Kissinger Analysis
Kissinger Analysis is the model-free (isoconversional) method of kinetic analysis calculating dependence of activation energy value E at the point of maximum conversion rate αm for dynamic experiments with different constant heating rates β.
Kissinger method is different from Kissinger-Akahira-Sunose method, do not mix up them.
It is always necessary to check if this model-free method is valid to be used and is applicable because of restrictions of model-free methods.
Kissinger analysis belongs to the group of single-point model-free methods where activation energy value is found from general kinetic equation Eq. (1):
only at the point of maximum conversion rate αm , where time derivative is equal to zero, Eq.(2):
After substitution of Eq.(1) into Eq.(2) and rearrangement the dependence of maximum conversion rate αm over heating rate β is found, Eq. (3):
Taking logarithm of Eq. (3) the linear dependence is found, Eq (4):
If the points of maximum conversion rate αm with the assumed same degree of conversion (isoconversional points) will be taken from experiments performed at different heating rates, then values ln[(AR/E)*(-df(α)/dα)] will be the same for all of experiments and Eq. (4) will look like the straight line, EQ. (5):
y = b + ax
Where
- y = ln(β/Tm2),
- b = ln[(AR/E)*(-df(αm)/dα)],
- a = E/R,
- x = -1/T
The Kissinger plot y(x) looks like the straight line for values αm , where the activation energy can be found from the slope and pre-exponent from the intercept for known (or assumed) f(α).
Often in Kissinger method the assumption of the first order reaction is done f(α)=1- α, then (-df(α)/dα)=1, and pre-exponential factor can be found from intersect b for known activation energy E.
Advantages and disadvantages of this method and a comparison table with other methods.
Kinetics Neo
Kissinger Analysis method is not the same as Kissinger-Akahira-Sunose (KAS) which is a different method. Kissinger Analysis in Kinetics Neo is model-free method named ASTM E2890 .
Steps to apply Kissinger method in Kinetics Neo:
- Import Experimental data in Kinetics Neo.
- Select ASTM 2890 in Model-free section to get Kissinger plot
- Find Activation energy E and pre-exponent A at the point of maximal reaction rate for the assumption of first-order reaction on Properties panel of ASTM 2890 model-free analysis
- Find fit quality R2 on the Property panel for experiments and simulation for Kissinger values E and A under assumption of the first-order reaction. If R2>0.99 then Kissinger method is applicable to get activation energy.
Example
Dimerization of cyclopentadiene:
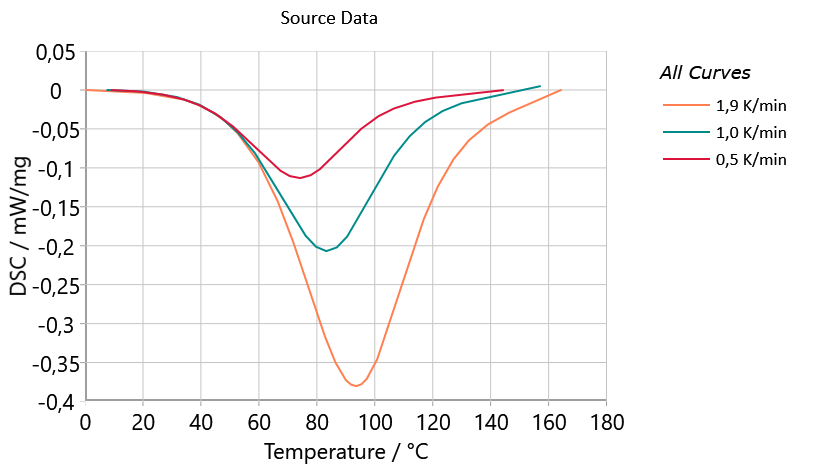
- Experimental data (Fig.1),
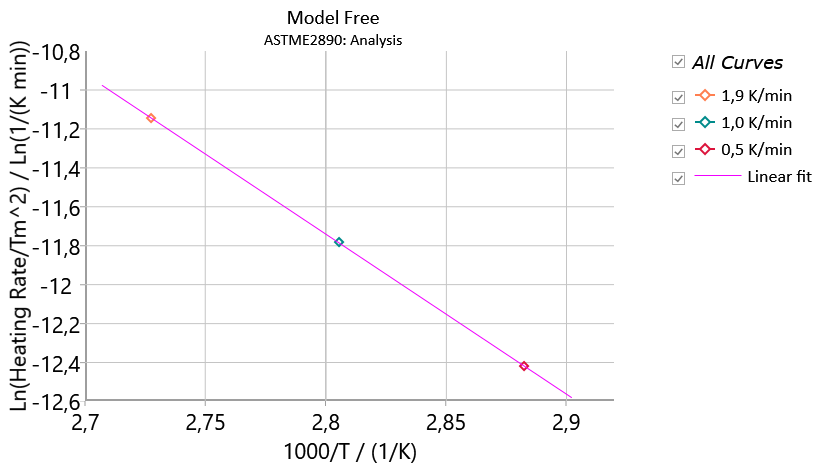
- Kissinger plot(Fig.2),
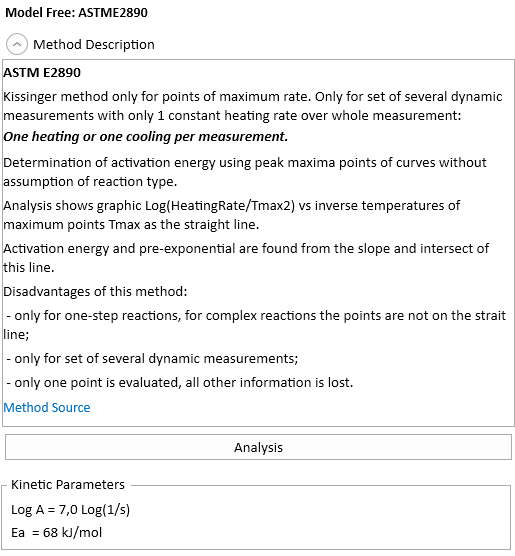
- Activation energy E and pre-exponent A at the point of maximal reaction rate for the assumption of first-order reaction (Fig.3)
- Comparison between experiments and simulation for Kissinger values E and A under assumption of the first-order reaction(Fig.4):
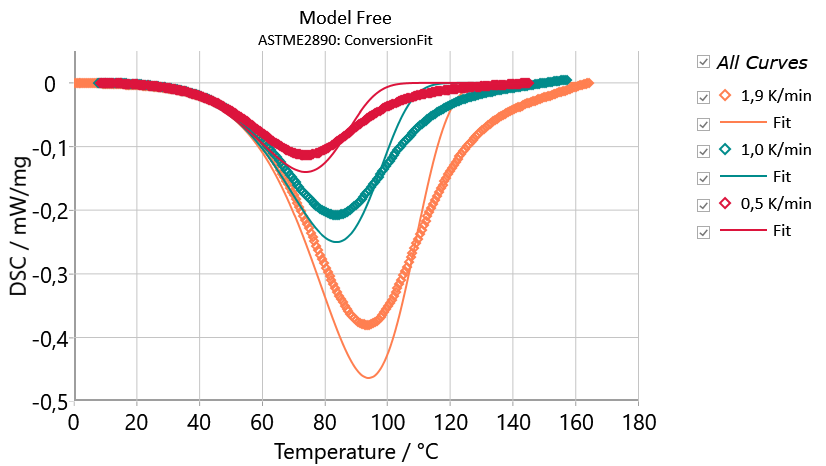
It is seen that the simulation according to the model-free method of Kissinger has the peak points at the same position as the peak points of experimental data. However, the shape of simulated curve differs from the experimental curve if the reaction type is not equal to the assumed first-order reaction. It is always necessary to simulate the curves by Kissinger method and compare them with experiment. This comparison helps to check if Kissinger method is suitable for analysis of the current reaction.
Reference
- Vyazovkin, S., et al., ICTAC Kinetics Committee Recommendations for Performing Kinetic Computations on Thermal Analysis Data, Thermochimica Acta520 (2011) 1–19. https://doi.org/10.1016/j.tca.2011.03.034
- ASTM E2890 Standard Test Method for Determination of Kinetic Parameters and Reaction Order for Thermally Unstable Materials by Differential Scanning Calorimetry Using the Kissinger and Farjas Methods , https://store.astm.org/e2890-21.html