An Introduction to n-th Order and Autocatalysis Reactions
4. Auto-Catalysis Reaction
Chapters
- Introduction
- Homogeneous Reaction System
- n-th Order Reaction
- Auto-Catalysis Reaction
- How to Distinguish between n-th order and Auto-Catalysis Reactions from Thermal Analysis Curves
- Combined Auto-Catalysis Reaction
- Example: Thermocuring of Epoxy Resin - a Comparison of Different Reaction Types
- Conclusion and References
4. Auto-Catalysis Reaction
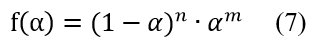
An auto-catalysis reaction, which belongs to self-accelerating reactions, is a kind of reaction where the reaction rate will increase with the generation of product. The general equation for this is the extended Prout-Tompkins equation (Bna):
Here 1-α corresponds to the relative amount of reactant, α corresponds to the relative amount of product, and the reaction rate is the function of the two. The latter will decrease with the consumption of reactant and increase with the generation of product. Some examples in chemistry are:
- curing
- cross-linking reactions
- fermentation reactions
- polymerization reactions
- chain reactions, etc.
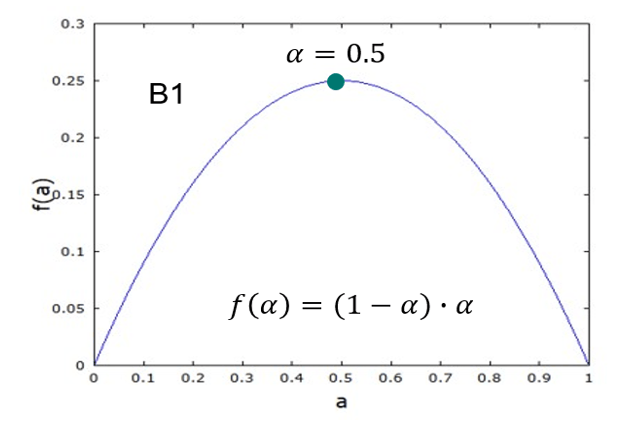
The simplest auto-catalysis model is the Prout-Tompkins equation (B1):
fα=(1-α)∙α
It is a simplification of Bna (n=1, m=1), and can be used to describe the following reaction:
A + B -> 2B
Fig.3 presents the concentration of reactant A and product B for isothermal autocatalytical reaction:
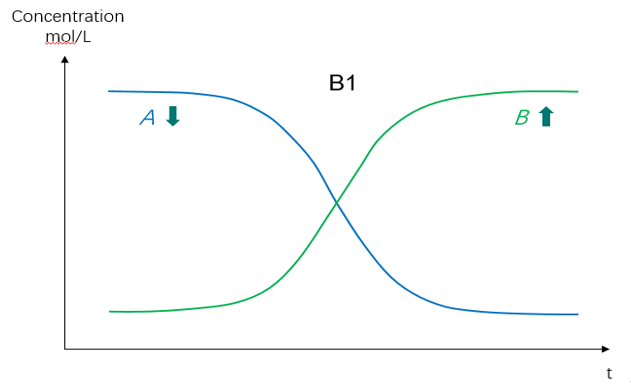
Here the reaction rate still decreases with the consumption of A. But once B is generated, it plays another role as reactant which will boost the progress of the reaction. Both curves are sigmoidal, and the sigmoidal shape for degree of conversion for isothermal measurement is the evidence of the reaction with self-acceleration.
In the beginning stage of the reaction, when the concentration of B is very low, the reaction rate is low; in the final stage when the concentration of A is already very low, the reaction rate is also low. The maximum of the reaction rate will appear at the stage when the concentrations of both A & B are sufficient, i.e., in the middle stage of the reaction. This rule can be verified by the plotting of equation B1, which is shown in Fig.4.