What is new in Kinetics Neo version 2.5.5
Model Summary table values can be exported into the ASCII text file
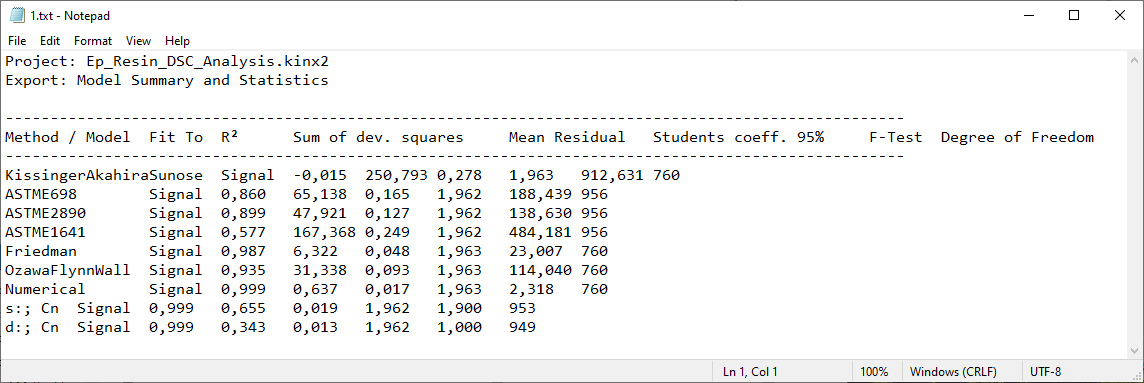
The values in the table Models Summary can now be exported into the test ASCII file (TAB separated).
1. Select "Models Summary" on the left tree.
2. Check that the Models Summary table is shown on the right pane.
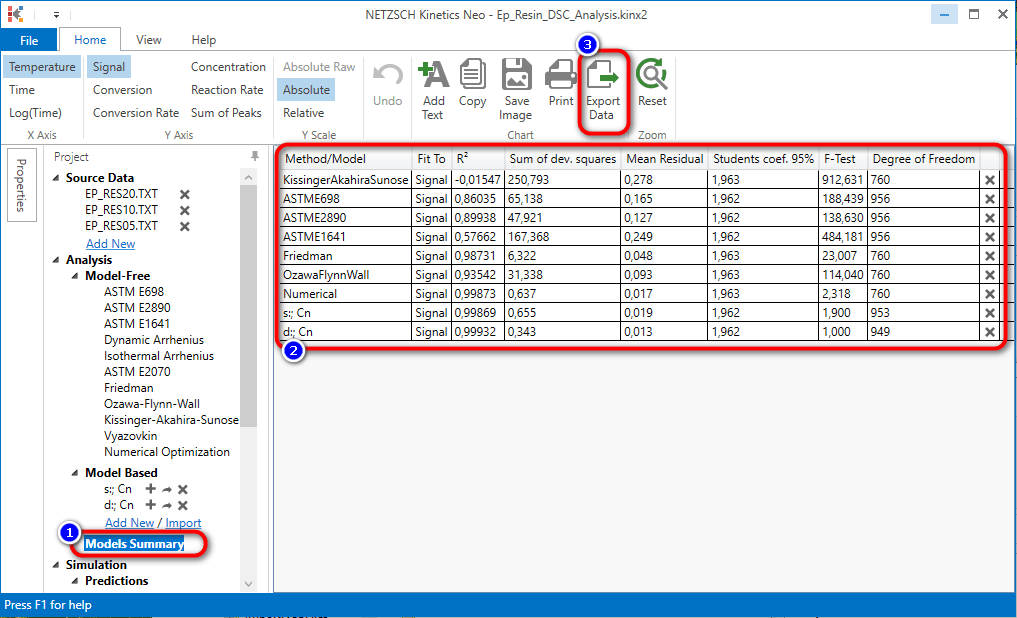
3. Click on the button "Export Data" on the main "Home" ribbon on the top. In the Save As dialog select the file name and click on Save.
The text file will be created and opened in defailt program for .TXT files (usually Notepad.exe).
Show / Hide the Visibility of the Curves on the Chart
This new feature is very important for presentations of Kinetics Neo and for publication of graphic results.
It is possible to SHOW or HIDE each curve on the chart by switching ON or OFF the checkboxes near the curve name in the legend.
The curves can be shown/hidden for Source chart, in the Analysis, Predictions and Optimization, and it is very helpful for the Sum of Peaks, where each experiment has several curves: see figures below.
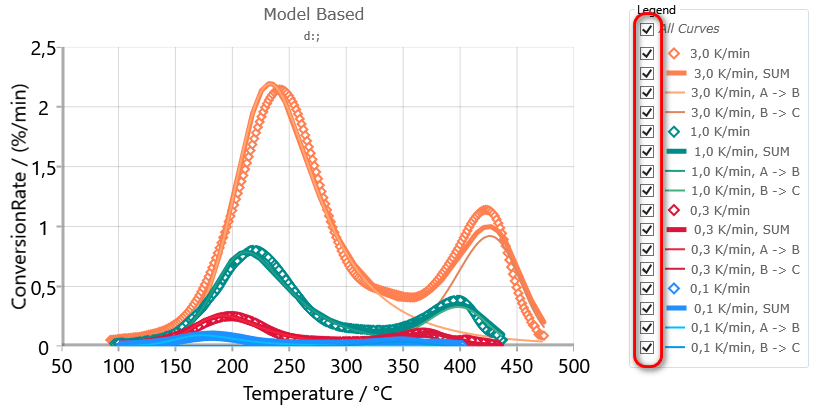
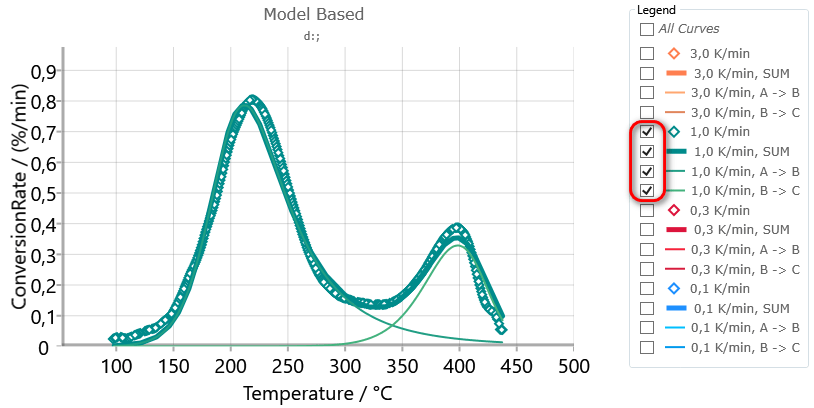
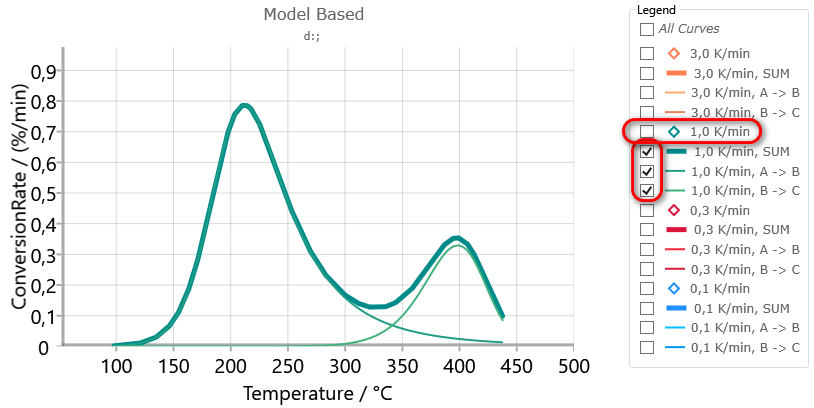
It is also possible to hide or show all the curves when you switch ON or OFF the checkbox All Curves.
Highlight the Curves by Using Several Effects Directly on the Chart Area, not only in Legend
Since version 2.1.2 it is possible to highlight the selected curve on the chart by clicking on the curve symbols on the legend. The curve symbol in the legend and also on the chart are shown thicker as the other curves.
Now it is possible to "highlihgt" the curves by only holding the mouse pointer over the curve ("hover").
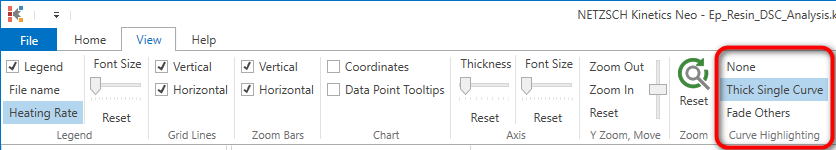
In Ribbon tab "View" you will find several highlihgting modes to select:
- None,
- Thick Single Curve (default),
- Fade Others.
None
The mouse cursor doesn't affect the curves highlighting when it moves over the curves. This behavior was standard for all previous Kinetics Neo versions.
Thick Single Curve
When the mouse cursor hovers over the curve on the main chart, the curve under the cursor painted thicker as the others. This effect is visible on the main chart and also in the legend.
Fade Others
Here when the mouse coursor hovers over the curve on the chart, the curve under the curson painted thickes as others and the other curves are faded (painted less visible). This is somehow similar to previous effect "Thick Single Curve". The difference is in the fading of the other curves. Now the curve under the curson is much better to see.
Click on the image below to see the video of this highlihgting effect: