What is new in Kinetics Neo Version 2.1.2 (December 10, 2018)
Build 2.1.18344.2
New in Analysis
Nakamura Crystallization Analysis
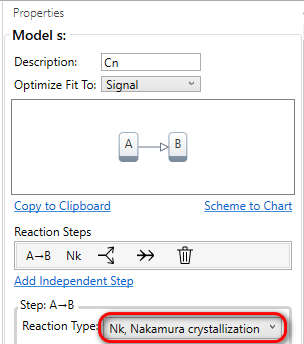
Main new feature is the support of the Nakamura crystallization analysis with Hoffman-Lauritzen temperature dependence. This analysis takes into account glass transition temperature and help you to predict degree of crystallinity during cooling of polymers.
Nakamura crystallization analysis is implemented in Kinetics Neo as a new reaction type for a model-based analysis like F1, F2, Fn …
Selecting the Optimization Targets in Model-Based Analysis
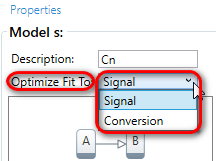
New option Optimize Fit To for model based optimization of parameters is added. Now the optimization target could be:
- signal (default),
- conversion rate.
This gives the opportunity to change the optimization target in model based analysis. This parameter is also added to the Models Summary table.
Usability Improvements and New Features
Selecting (Marking) A Curve On The Chart
Line on the chart can now be permanently marked, or “selected”. Just click on the line or label in the chart legend and the line will be marked:
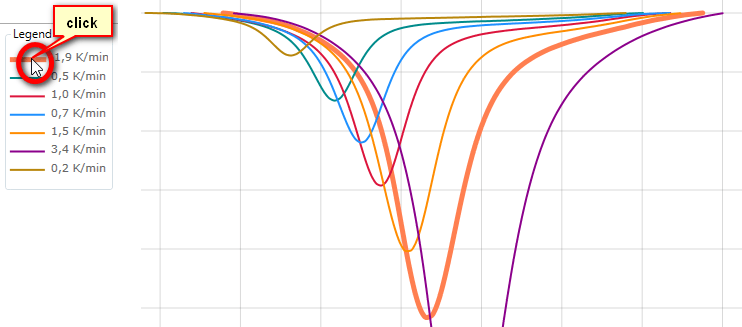
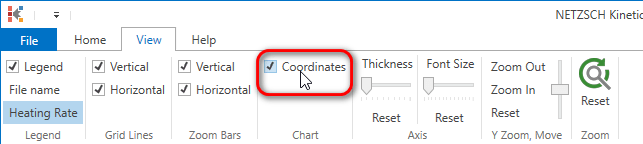
Chart Coordinates Mode
Now you can switch the Chart Coordinates mode on / off in the View tab (see below).
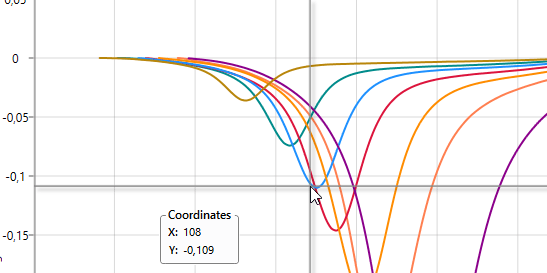
If this mode is switched ON – the crosshair lines will be shown under mouse pointer and the chart coordinates box appear on the chart (see right).
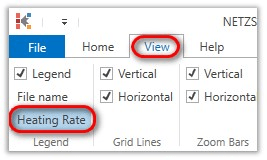
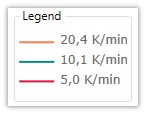
Heating Rate As The Curve Label
New in the chart legend: It is possible to select File Name or Heating Rate as a label of the curves in many charts including source data, model based etc. This setting is in tab View - > Legend.
Heating Rate setting is now selected by default.
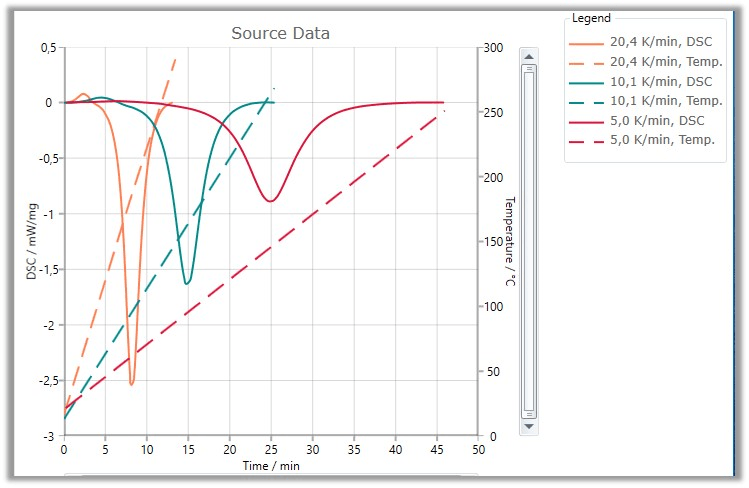
Color Of The Temperature Curves
Now the color of temperature program curves is the same as signal/prediction/optimization curves. This simplifies the identification of the temperature curve for a signal.
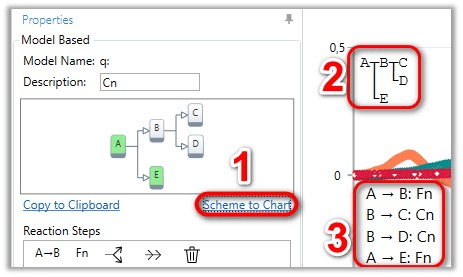
Model Scheme And Summary Of Reaction Steps On The Chart
One of the most desired feature is implemented: model scheme and summary of model steps on the Model-Based chart can now be shown directly on the chart as a movable text elements.
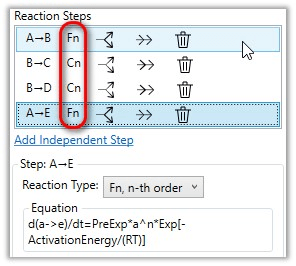
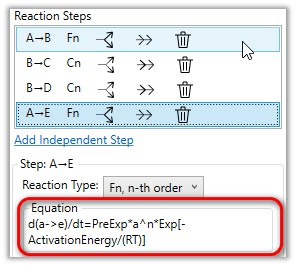
Equation Of The Reaction Step
Equation of selected reaction step is now shown on the model based panel. The equation text can be copied to the clipboard.
Reaction Type For Each Step
Reaction type for each reaction step is now shown in the list of reaction steps in the model based panel.