What is new in Kinetics Neo Version 2.4.4 (October 30, 2019)
Build 2.4.19303.6
New in Predictions
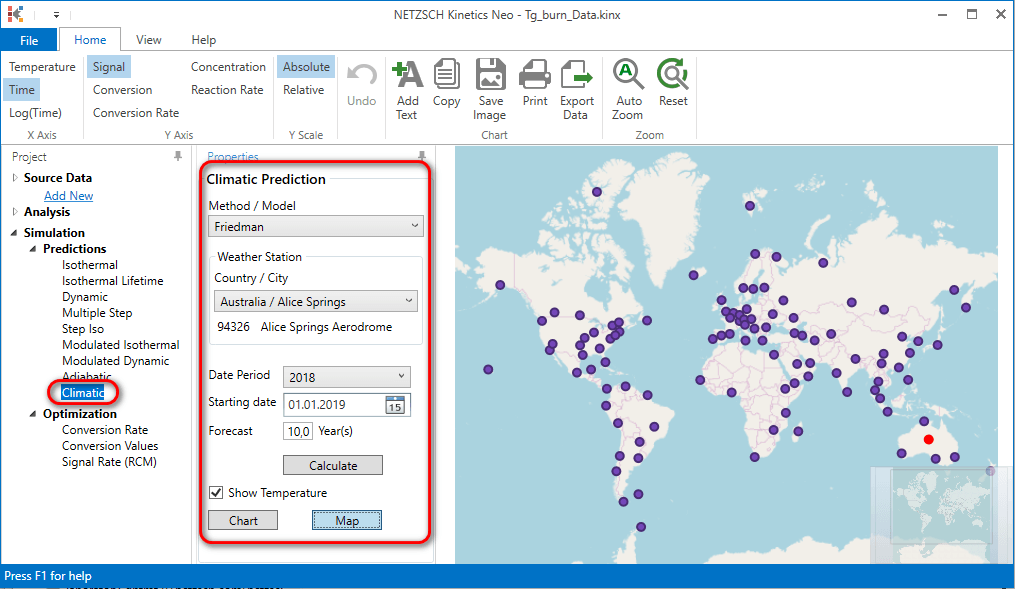
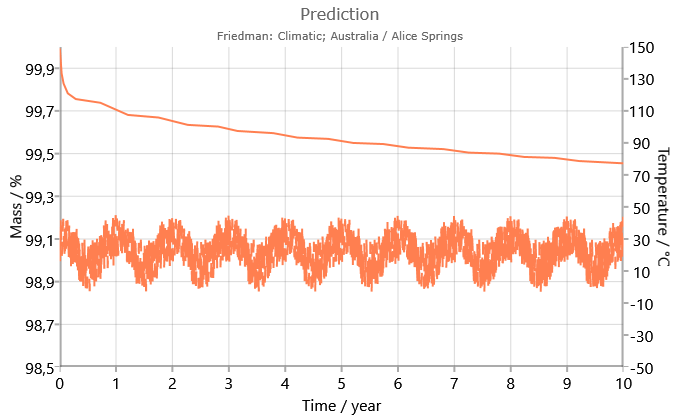
Predictions Based on Climate Temperature Profile
(“Climatic Predictions”)
Predictions based on climate temperature profile (later called as Climatic Predictions) in Kinetics Neo are the predictions of reaction progress for the real atmospheric temperatures for selected point on the Earth, from the selected day of the year, for the selected durations, which is usually several months or years.
See more information in the article "Predictions Based on Climate Temperature Profile".
New in Analysis
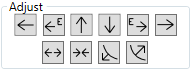
New Adjusting Arrows for Model-Based Analysis
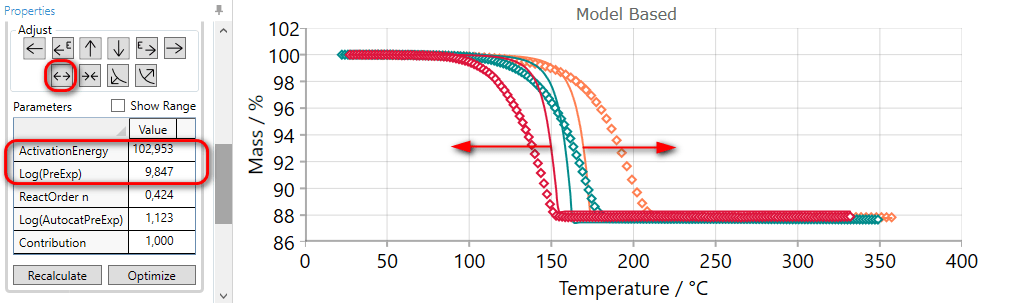
In model-based analysis the software searches the optimal kinetic parameters in order to get the best fit for the experimental curves. This optimization task is non-linear for the models with several reaction steps, and result depends on the initial values of parameters. The closer these initial values are to the optimal values the better will be the resulting fit after optimization.
It is not always necessary, but sometimes it is extremely useful and time saved to adjust the simulated curves manually, before optimization, to get them closer to the source measured data. This can be done by using the adjusting arrow buttons.
See separate document Adjusting_arrows.pdf about purpose, using of the adjusting arrows in model-based analysis.
For example, If the simulated curves for selected step are placed too close to each other, then they can be spread by the using of SPREAD adjusting arrow button:
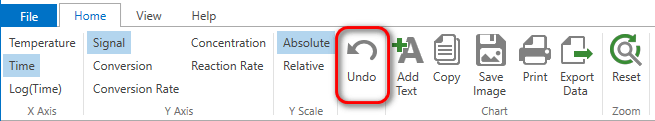
Undo for Model-Based Analysis
This new feature is based on several wishes of our coustomers: undo for all user's actions in Model-Based analysis. Sometimes the changing or optimizations in model – based analysis gives the results which are worse as before. And it was complicated and sometimes impossible to return the analysis to the previous state.
Now it is possible to use Undo action to revert the changes after model recalculation or optimization.
This function works only for Model-Based analysis.
Usability Improvements and New Features
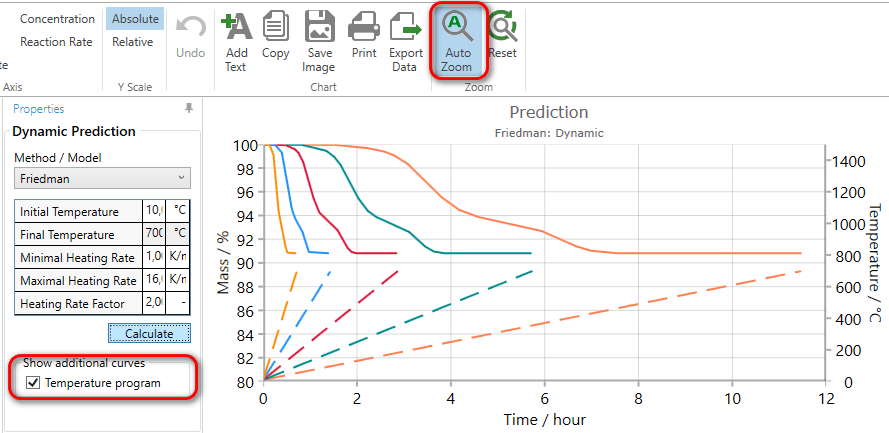
Auto Zoom for Charts with Two Y Axes
If two different charts are shown on the same chart plot sometomes it is difficult to separate the chart curves visually. Especially when each chart has many curves. Now two charts can be auto-arranged one above the another. If the Auto Zoom setting is switched on - it applies for all charts until it is switched off.
This tool is visible only when two different Y axes are used, for example, Signal and Temperature:
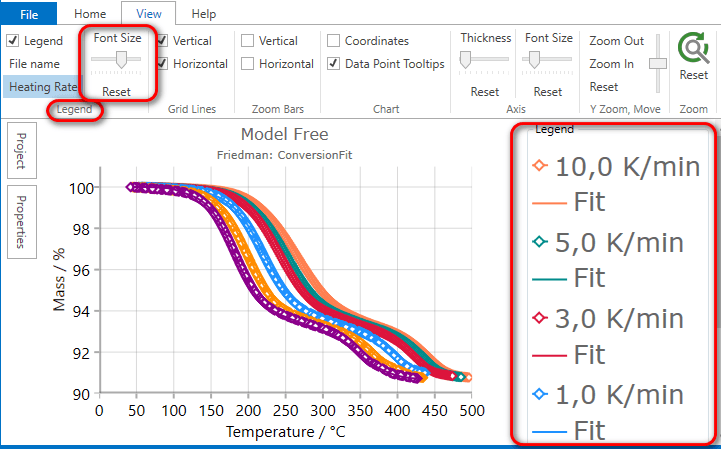
Font Size for The Chart Legend
Font size for the chart legend can now be changed (increased / decreased) independently on chart font size.
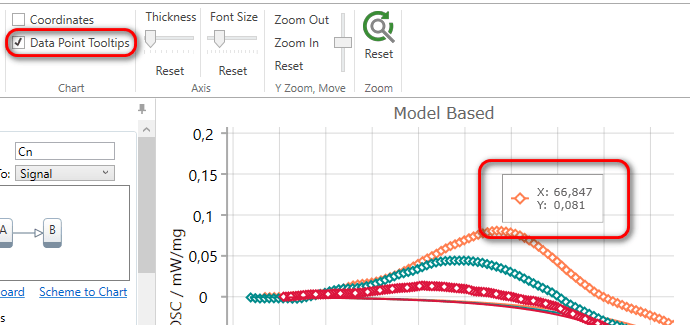
Tooltip on Chart Data Points
In main data chart the lines with markers now have Tooltips showing the data point coordinates / values. This can be switched ON or OFF in a "View" ribbon:
Adding Measurement Files by Drag and Drop
Now it is possible to add an ASCII or CSV measurement file to the Kinetics Neo project by just DRAG AND DROP action directly from the Windows Explorer. This feature is also asked by our customers because this save time by adding files to a new project.
Other Improvements and Error Fixes
Improved: Parameter Title is changed from AutocatOrder to Log(AutocatPreExp) for autocatalitic reactions C1,Cn.Cmn,KS. Corresponding eqiations are corrected too
Improved: R² statistics is now shown with 5 digits after comma. Previously it was 4 digits.
Fixed: Heating-Cooling baseline for Dilatometer.
Fixed: The sum of contributions is always equal to 1 (one).
Fixed: When the source file to be imported doesn't contain any data for Kinetics Neo then it will not be imported. Previously the file without name and data was imported.
Fixed: NaN for A2 reaction type if educt=0.
Fixed: Chart data export now correctly exports simulated conversion rate values.
Fixed: Incorrect label "Correlation R" is changed to "R²" in Model Based and Model Free Properties panels.
Other small improvements and bug fixes.