Predictions Based on Climate Temperature Profile
Introduction
Predictions based on climate temperature profile (later called as Climatic Predictions) in Kinetics Neo are the predictions of reaction progress for the real atmospheric temperatures for a selected point on the Earth, from the selected day of the year, for the selected durations, which is usually several months or years. These predictions are important for:
- long storage under the climatic temperature conditions
- degradation processes of packaging and coating
- curing of paints or epoxy
- safe storage of high energetic materials.
Predictions can be done for the existing model-free method or for existing kinetic model which was created during model-based analysis.
Time View
Climatic predictions can be used only when the time is selected for X axis. If the time axis is not selected then the following message will be shown:
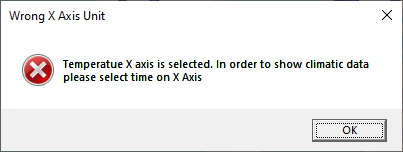
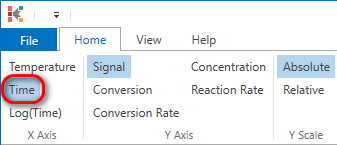
In this case please switch to time for X axis in order to use the climatic predictions:
Method / Model Selection
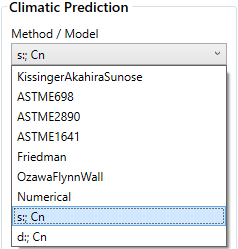
Firstly, the method or model used for predictions must be selected from the “Method/Model” list. This list is automatically populated when a method or model is calculated in Kinetics Neo. This happened automatically when a method or model is selected by the user in the “Analysis” tree on the left tree panel.
In this sample all tested methods/models are presented in the list.
Map with Weather Stations
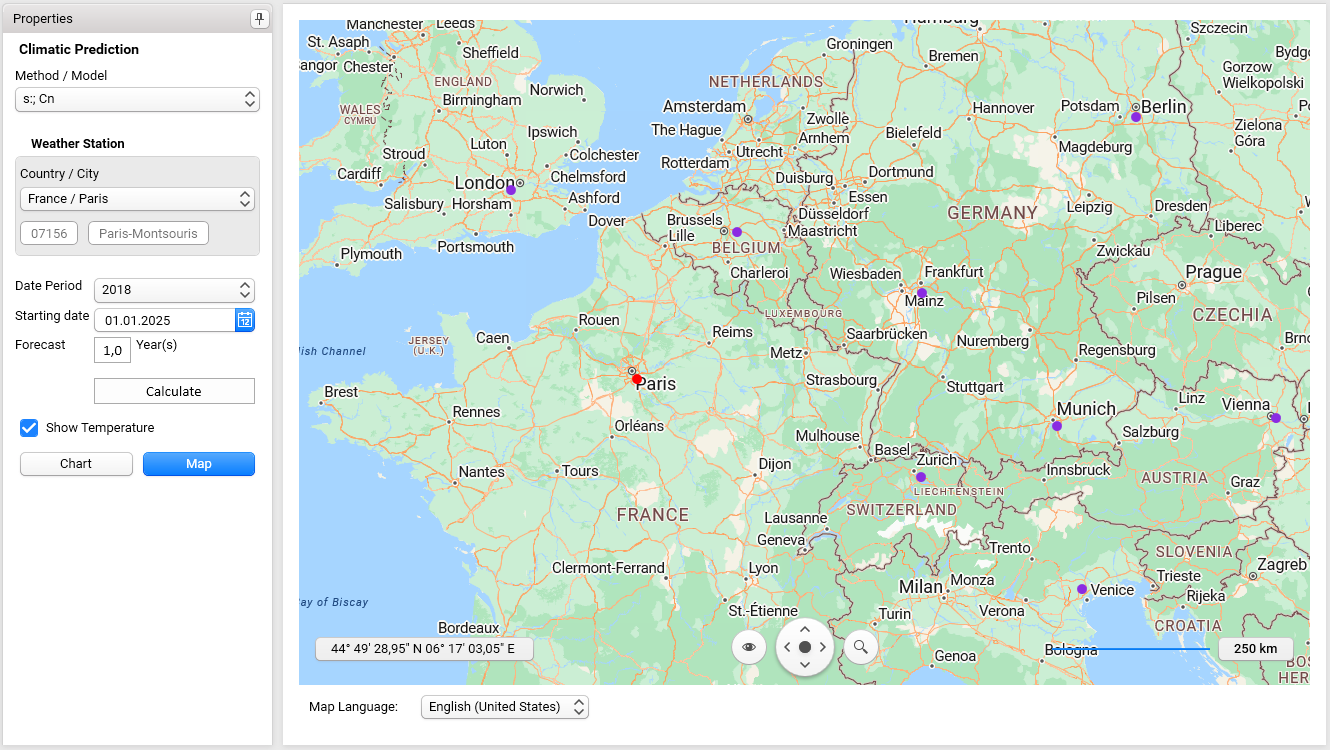
In Climatic predictions click on Map button to see all weather stations, data for which are present in the Kinetics Neo:
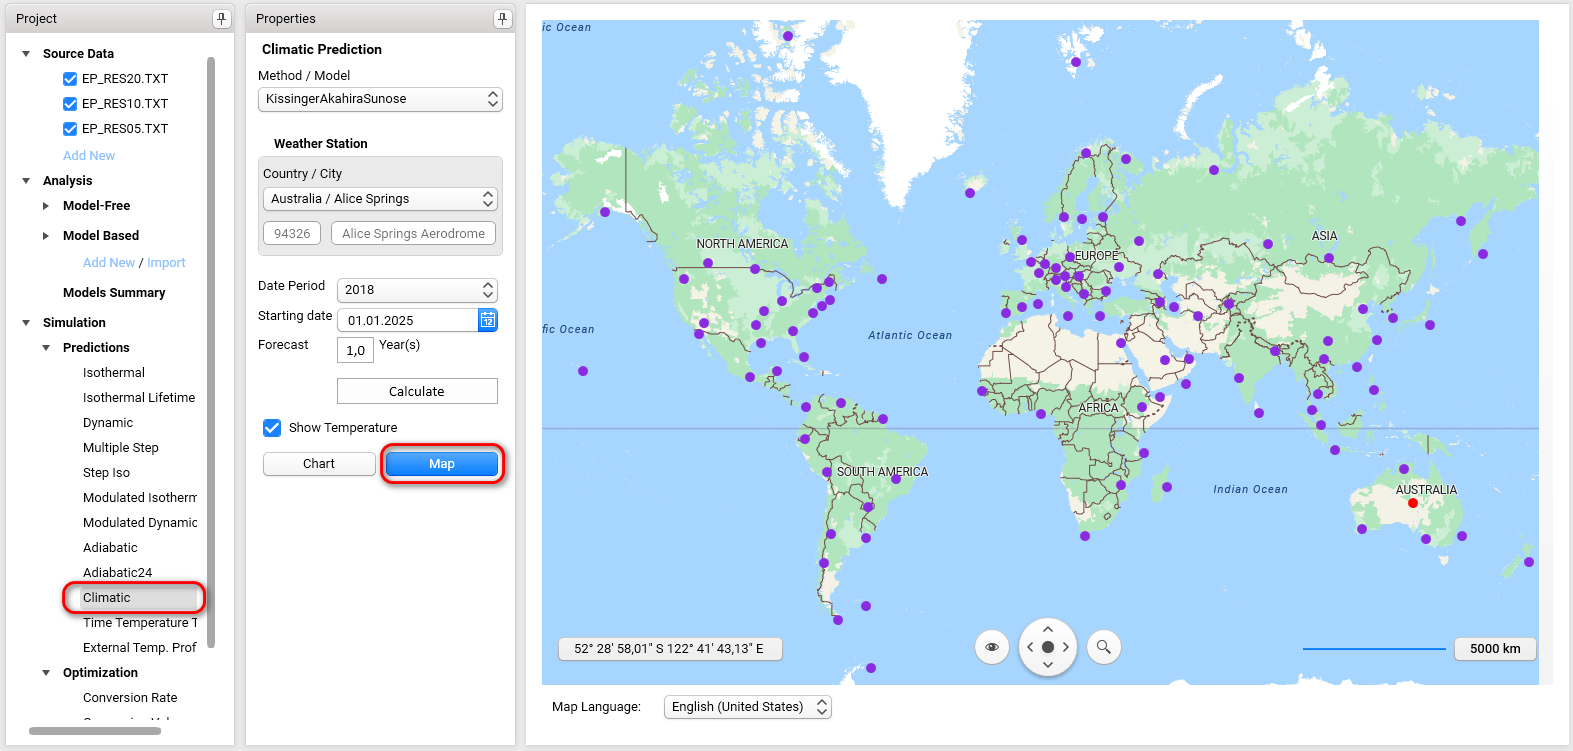
Kinetics Neo version 2.4 contains data and climatic temperature profiles for about 100 weather stations.
Interactive map with the possibility to select the station on the map is implemented since version 3.5.0.
This map can be zoomed/moved either by mouse pointer, mouse wheel or by the navigation tool in the right bottom corner of the map.
If you put mouse pointer over any weather station, then the station info is shown. It contains
- Country/city
- International ID code of the weather station
- Station name.
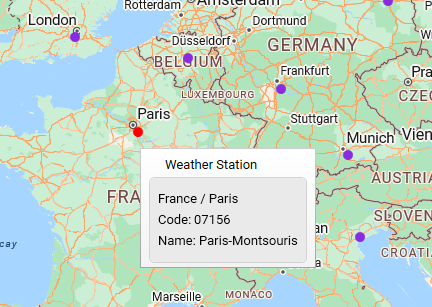
This map can find you the weather station which is closer to your destination.
List of Weather Stations
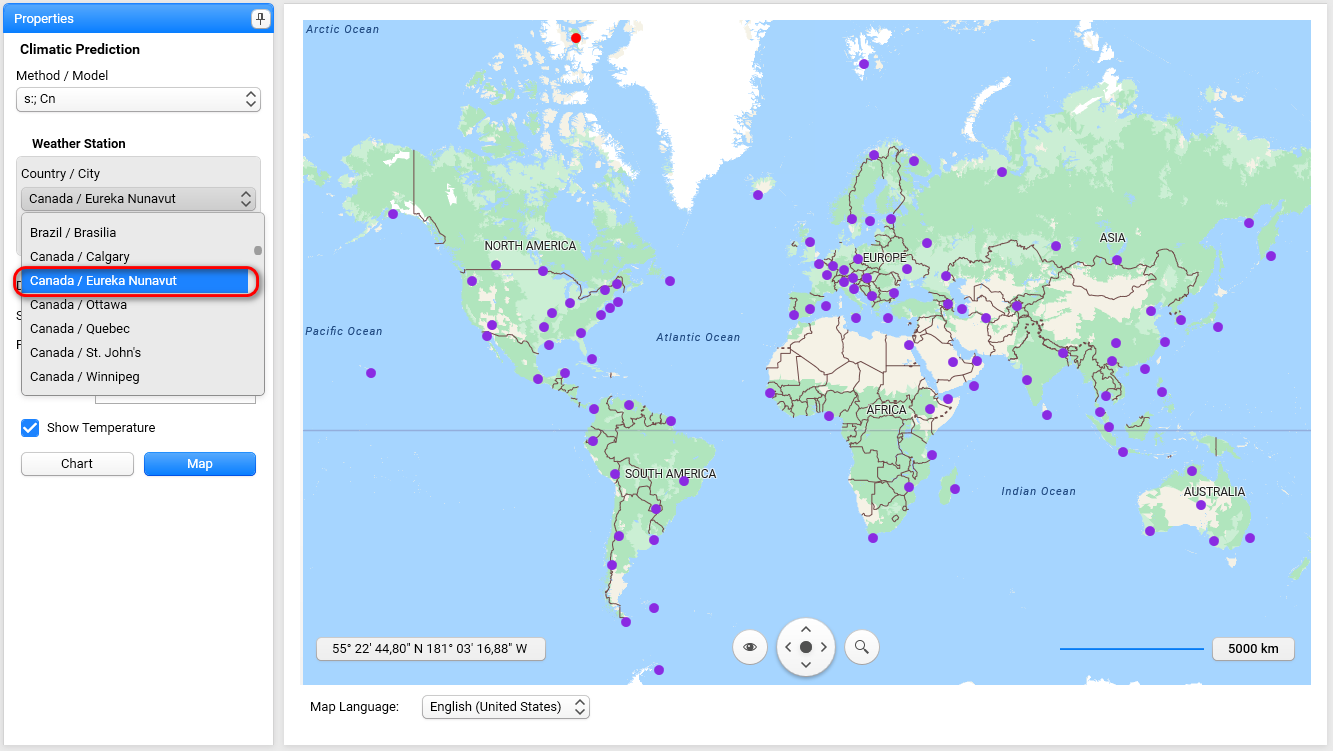
All weather stations are present on the map and in the station list.
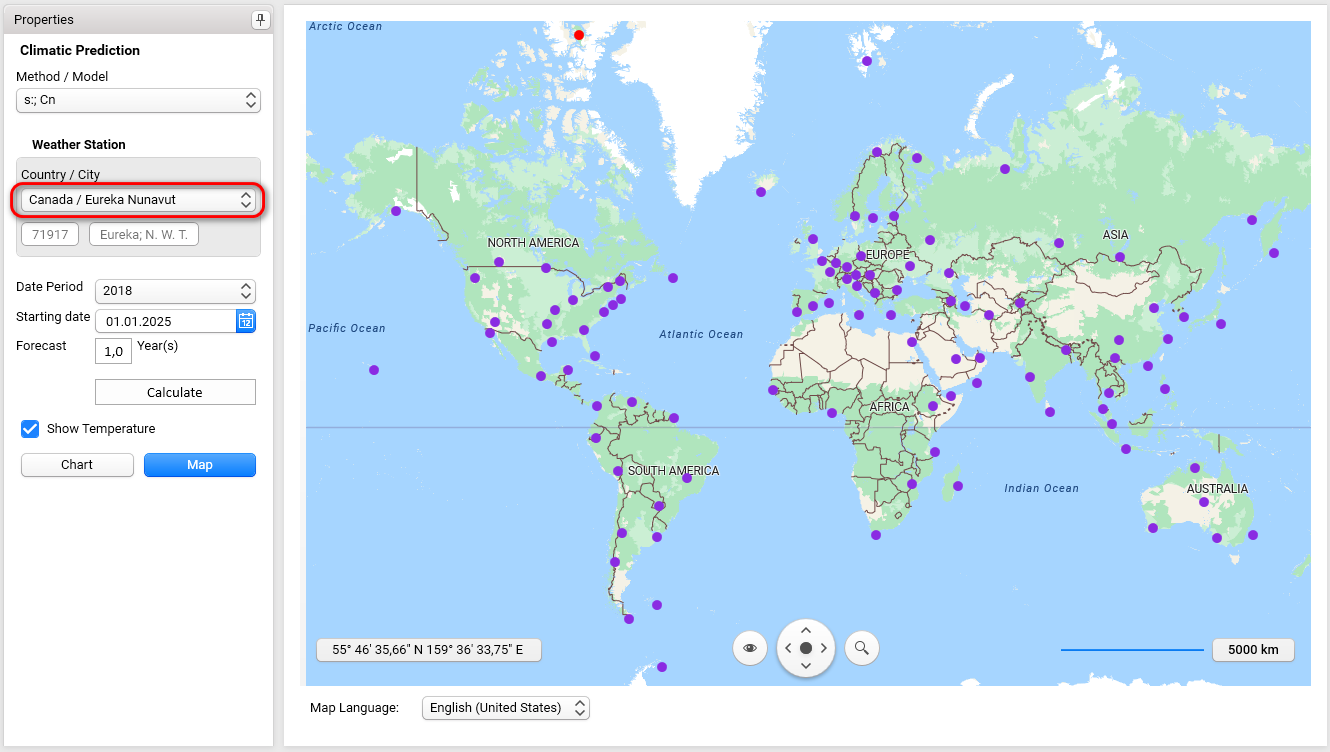
Please select your station from the station list or select it directly on the map (version 3.5.0 or later). It will be pointed on the map with the red circle.
For example, please select the mostly northern weather station of Canada: Eureka Nunavut. It is shown on the map here.
Date Period
There are 5 lines in the list for temperature data which will be used for the construction of the temperature program:
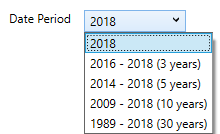
- 2018: Exact maximal and minimal temperatures for each day of year 2018 for selected weather station.
- 2016-2018(3years): Average daily minimum and maximum temperatures for 3 years (2016-2018).
- 2014-2018 (5 years): Average daily minimum and maximum temperatures for 5 years (2014-2018).
- 2009-2018 (10 years): Average daily minimum and maximum temperatures for 10 years (2009-2018).
- 1989-2018 (30 years): Average daily minimum and maximum temperatures for 30 years (1989-2018).
Temperature data profile contains either exact (for one year) or average (for several years) minimal and maximal temperatures for each day of the year. These temperature profile will be used for the prediction calculation.
If the measured data for the selected weather station are not complete then the corresponding period is not shown in the list.
Small gaps with the missed measured data like missed temperatures for Christmas every year are filled with interpolated values between neighbors’ dates.
Starting Date
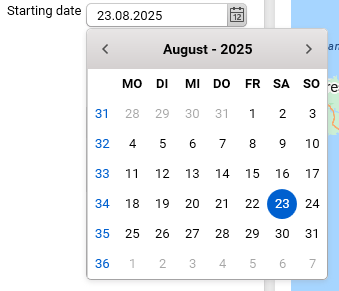
Predictions can be started from any day of the year. In this case the temperature profile starts with the temperatures of the selected day following by the rest 364 daily temperatures. In the following sample the prediction for 1 year starts on 23rd of August and ends on 22nd of August:
Forecast
Predictions can be done for one year, several years or for the part of the year. Please input the forecast duration in the Forecast input field.
Example of the Climatic Temperature Prediction
For the example please open the standard sample Ep_Resin_DSC_Analysis.kinx2 from DSC_Ep_Resin directory. This a standard sample is delivered with the Kinetics Neo.
Different Weather Stations
Canada/Eureka Nunavut
Select parameters as it is selected in the picture:
- Method/Model: Cn
- Country/City: Canada/Eureka Nunavut
- Date Period: 2018
- Starting Date: 01.01.2025
- Forecast: 1 year
- Show Temperature checkbox: ON.
Click on Calculate, in the toolbar select Time, Conversion and Auto Zoom:
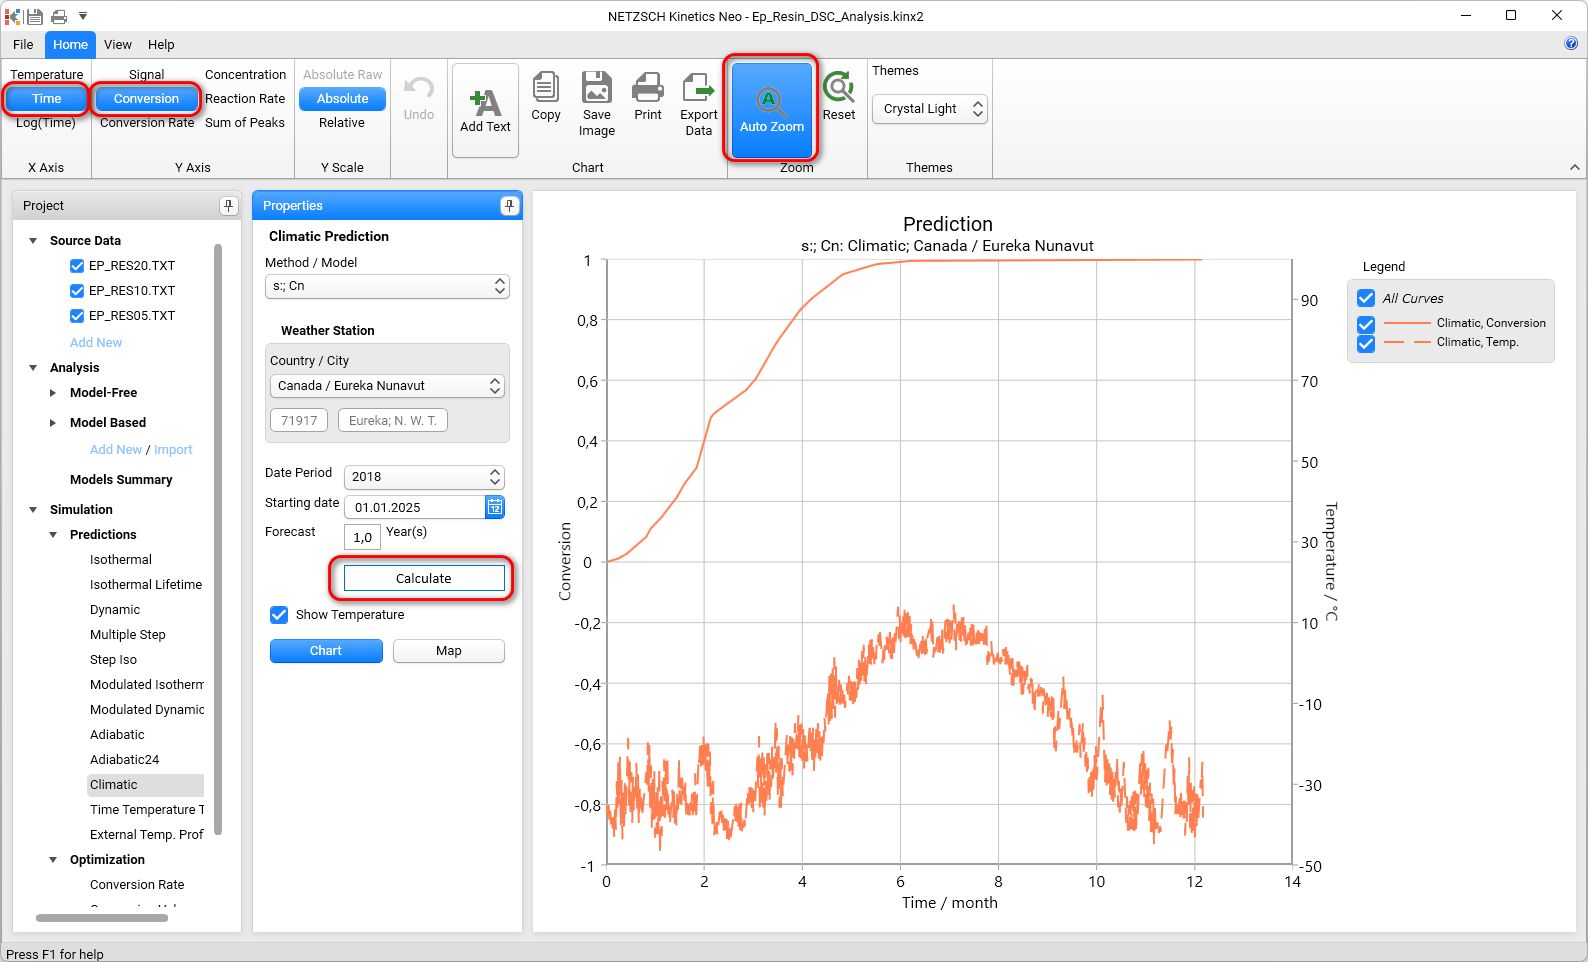
Here the lower curve is the measured maximal and minimal temperature for each day of the year 2018 for the selected weather station. It changed from -47°C in February to 14°C in August. The upper curve is the prediction of the curing process for these temperature conditions. Reaction starts slow in January and finishes to the end of June.
Germany/Berlin
Please click on Map and select Germany/Berlin. You can return to the chart view by click on Chart (return to old graph without recalculation) or Calculate (recalculate predictions according to the new parameters and show graph).
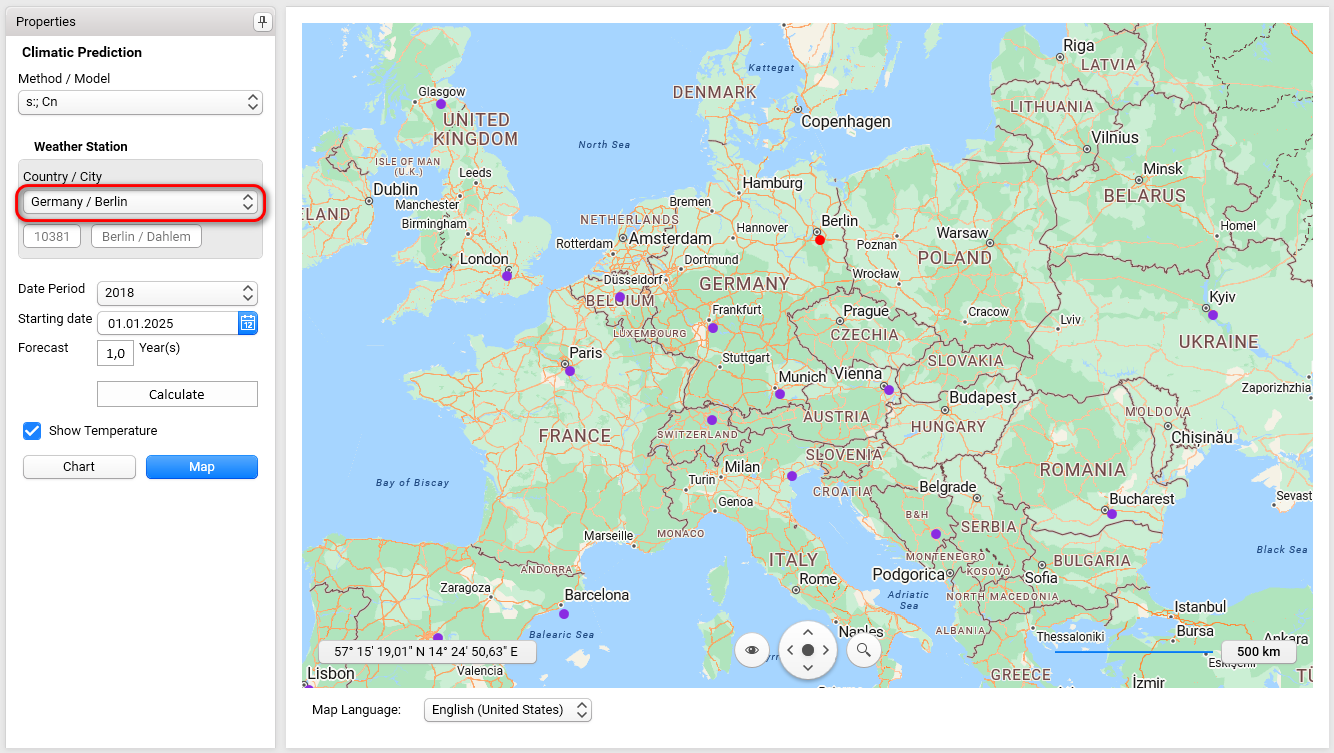
Click on Calculate:
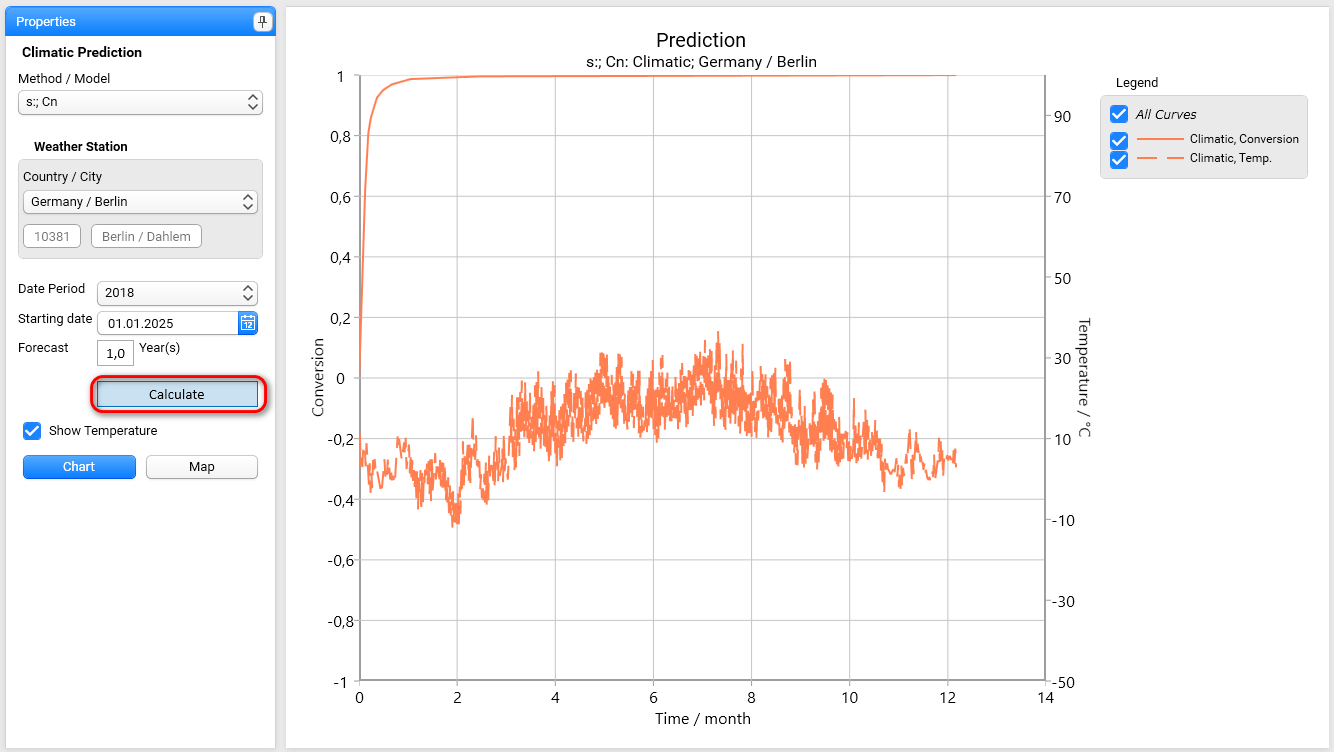
Here the reaction starts in January and finishes in March.
If Auto Zoom is ON then manual zoom is impossible. In order to activate the manual zoom, please switch off the AutoZoom function or click on the Zoom Reset button on the top ribbon bar.
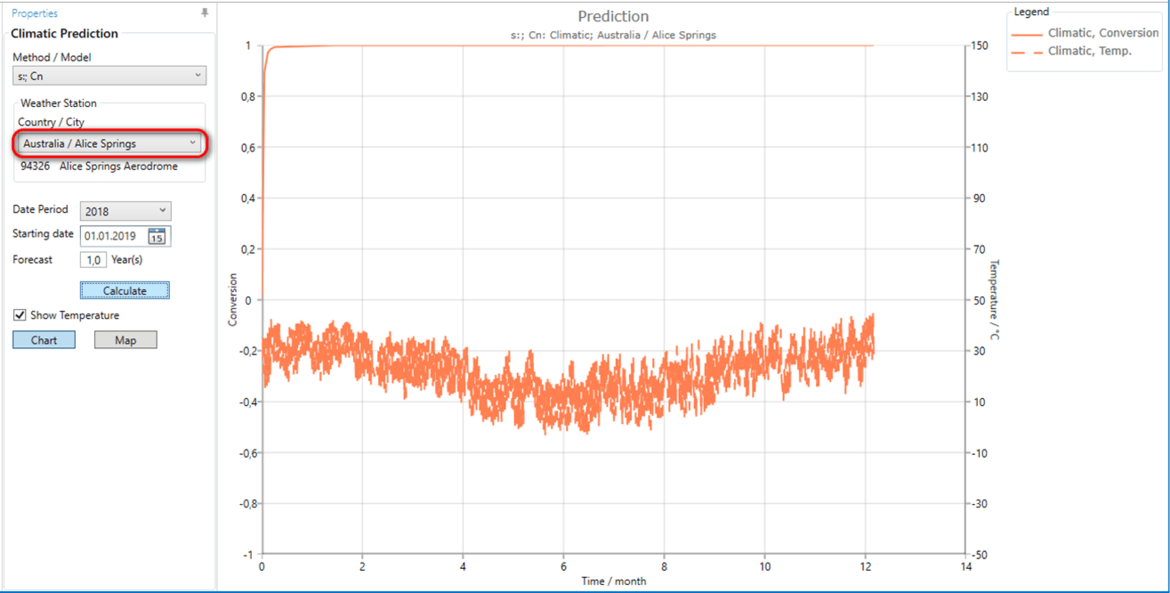
Australia/Alice Springs
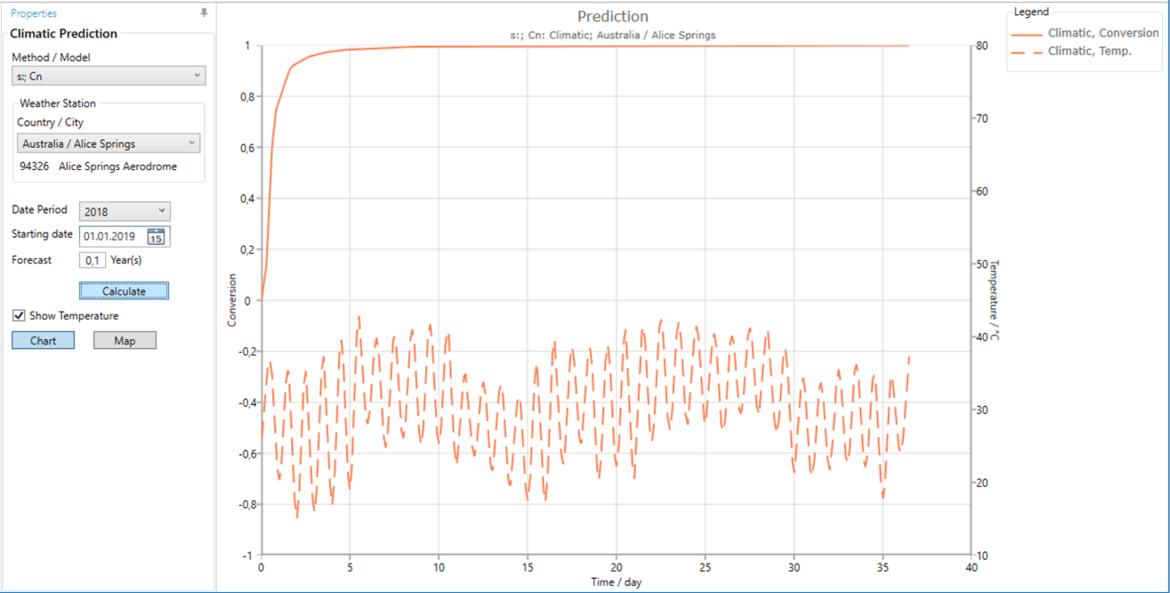
In Australia/Alice Springs the curing is finished very fast:
With the forecast for 0.1 year (36.5 days) it is seen that the reaction is finished after 1 week in January.
Different Data Period
In toolbar click on Reset Zoom and select predictions in Berlin for the temperature data of year 2018 and calculate predictions.
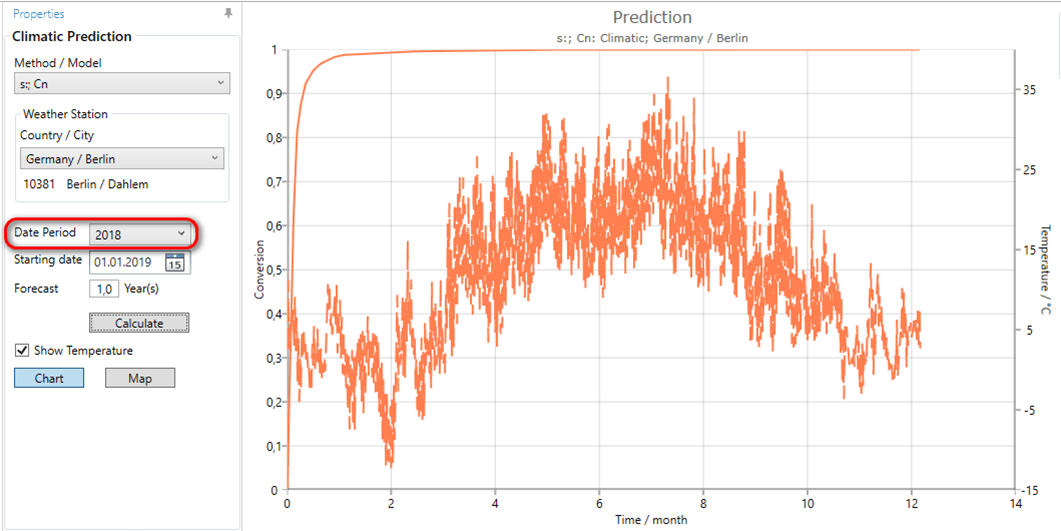
Here the temperatures have a lot of year-specific fluctuations, the temperature range is from -12 to 37°C.
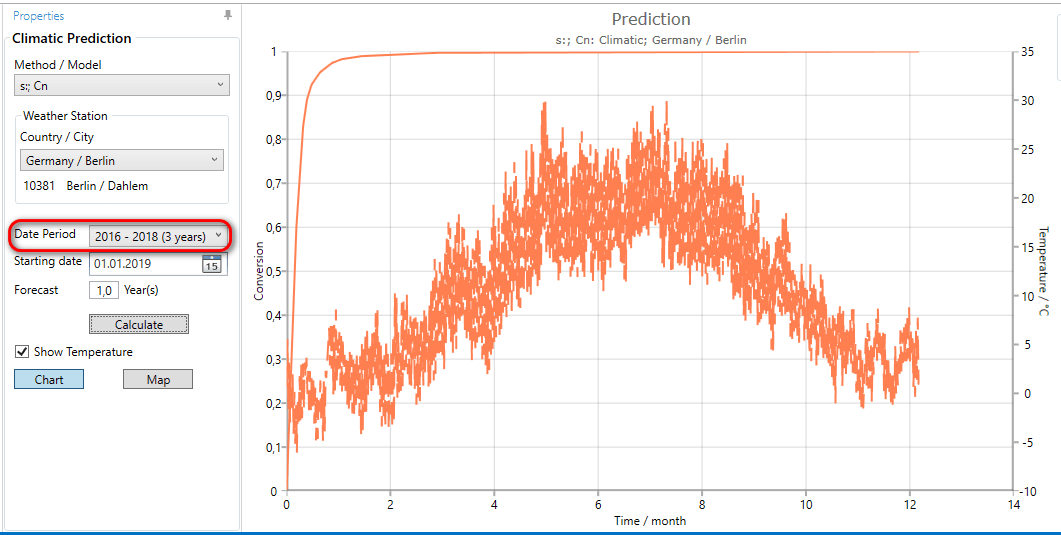
But for three-year period the temperature data are smoother: from -6 to 29°C.
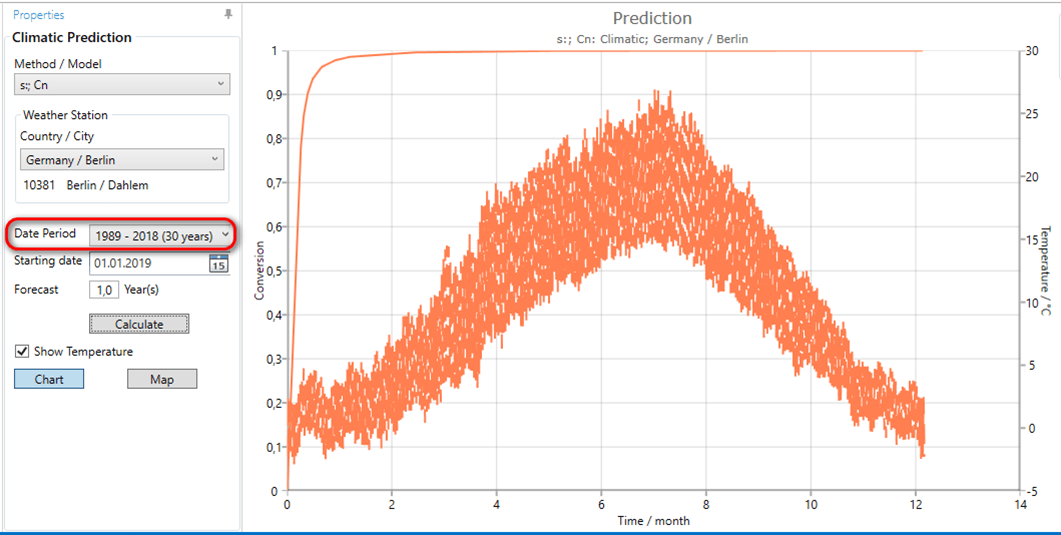
For thirty-years period the temperature data are only from -2 to 27°C because of the averaging of the minimum and the maximum temperature across these 30 years.
Different Starting Date
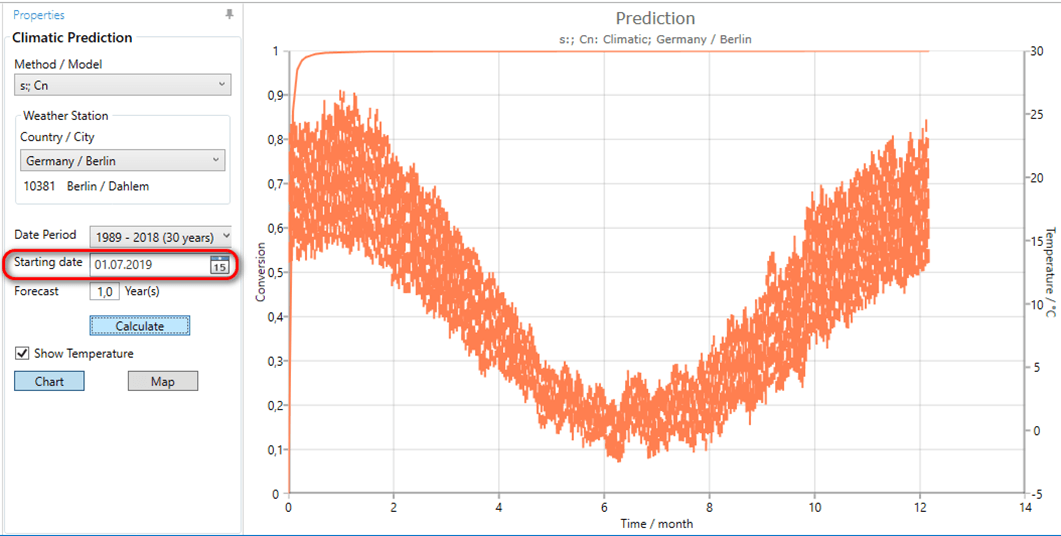
Calculation from the 1st of July present slow decreasing of the temperature during first half of year in forecast.
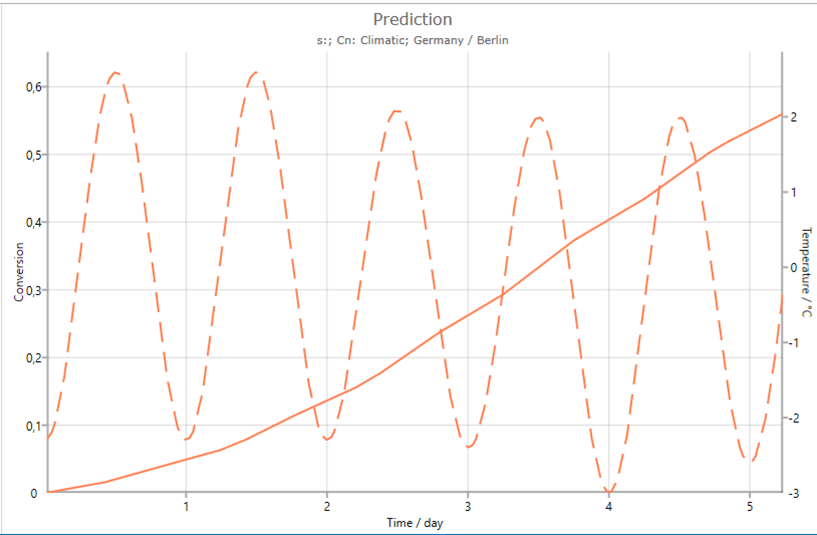
Zoom for the 5 days shows sinus-shaped oscillations between the maximal and minimal daily temperatures.