How To: Analyze Isothermal Crystallization of LDPE by ASTM 2070
Introduction
Crystallization process of polymers can be detected as the exothermal peak on DSC curve, where degree of conversion changes from 0 to 100%. However, at the end of this process, the maximal degree of crystallinity is usually below 100%, and the conversion calculated from DSC curve means the relative crystallinity, where 100% of conversion means maximal measured crystallinity value.
The model-free analysis according to ASTM E2070 is an isoconversional method only for isothermal data. At least two measurements at different isothermal temperatures are required.
The determination of the activation energy is using the points at the same conversion (0.01, 0.02, …, 0.99, 1.00) from the measurements at different isothermal temperatures. There is no assumption about the reaction type.
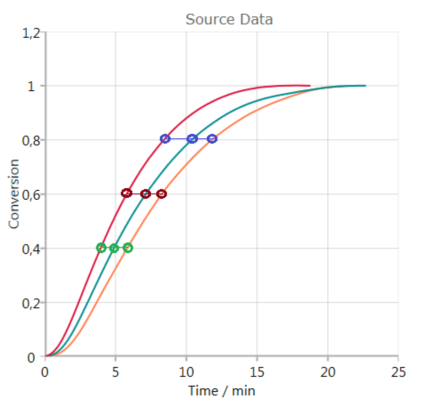
In the following example, conversion data for the isothermal crystallization of a polymer are shown, where the crystallization process is faster the lower the temperature is (103.5°C: orange; 103.0°C: cyan; 102.5°C: red).
Activation energy and pre-exponential are found from the slope and intersect of these lines.
Advantage of this method: each reaction point is evaluated.
Disadvantages of this method:
- only one-step reactions, for complex reactions the points are not on the straight line
- only for the set of several isothermal measurements.
Method Source: ASTM 2070, Method A. https://www.astm.org/Standards/E2070.htm
Load the Sample Data project
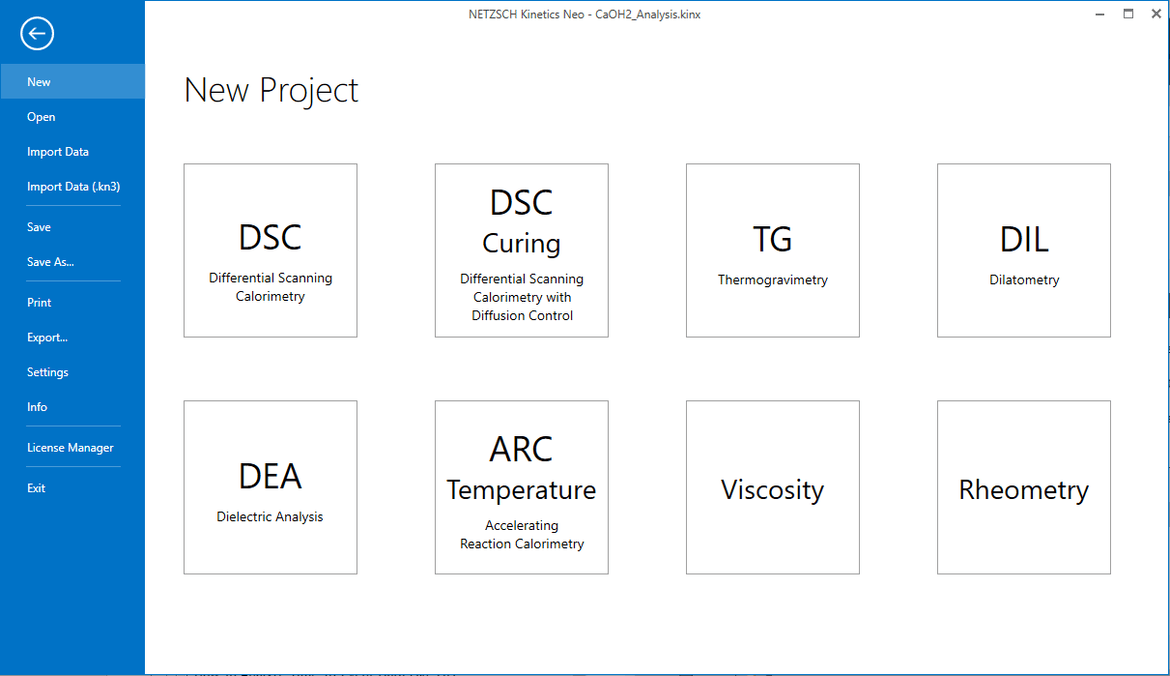
1. Start the Kinetics Neo software.
Click on the blue "File" tab to open the application menu.
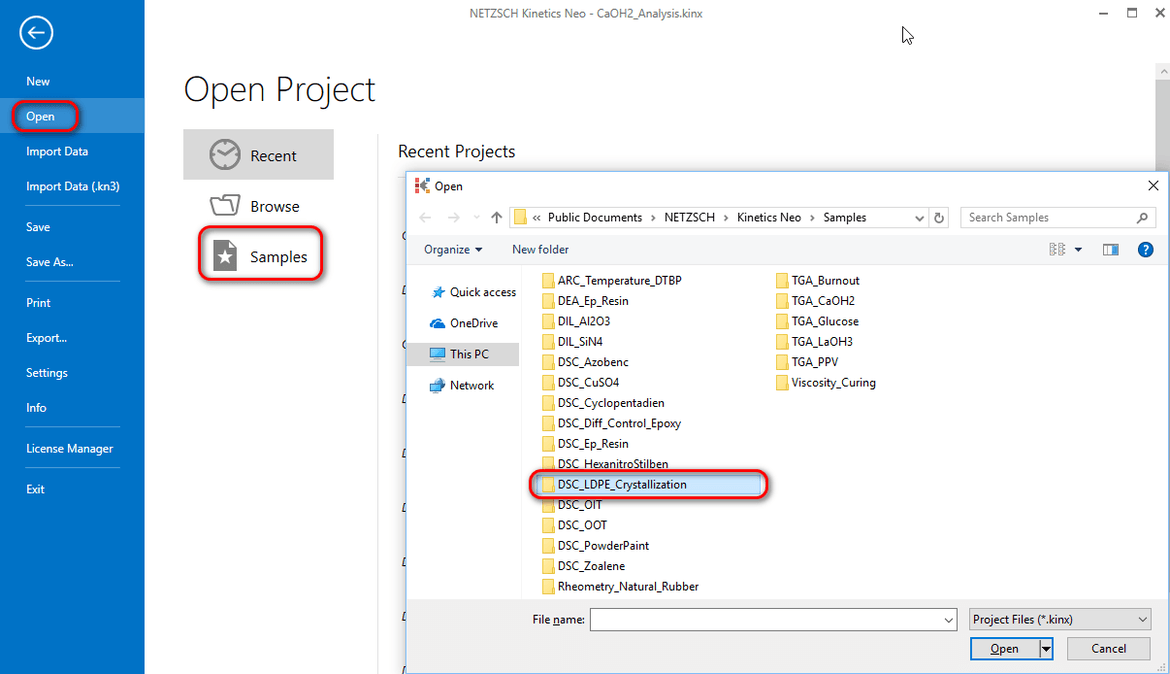
2. Open the Sample Data DSC project.
Click on "Open" in the menu on the left side, then select "Samples". The Kinetics Neo samples directory will be opened in Windows Explorer. Select the directory “DSC_LDPE_Crystallization”.
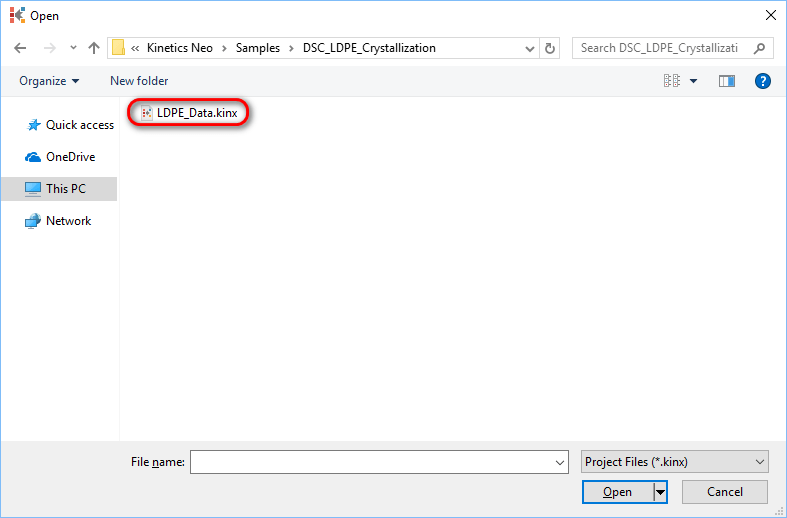
3. Open the Kinetics Neo project file “LDPE_Data.kinx2” . This project contains isothermal measurements of Low Density Polyethylene (LDPE).
4. Adjust parameters of data visibility.
On the main top ribbon select "Time" for X axis. On the properties panel enable the visibility of the Temperature curves by clicking on "Temperature" checkbox.
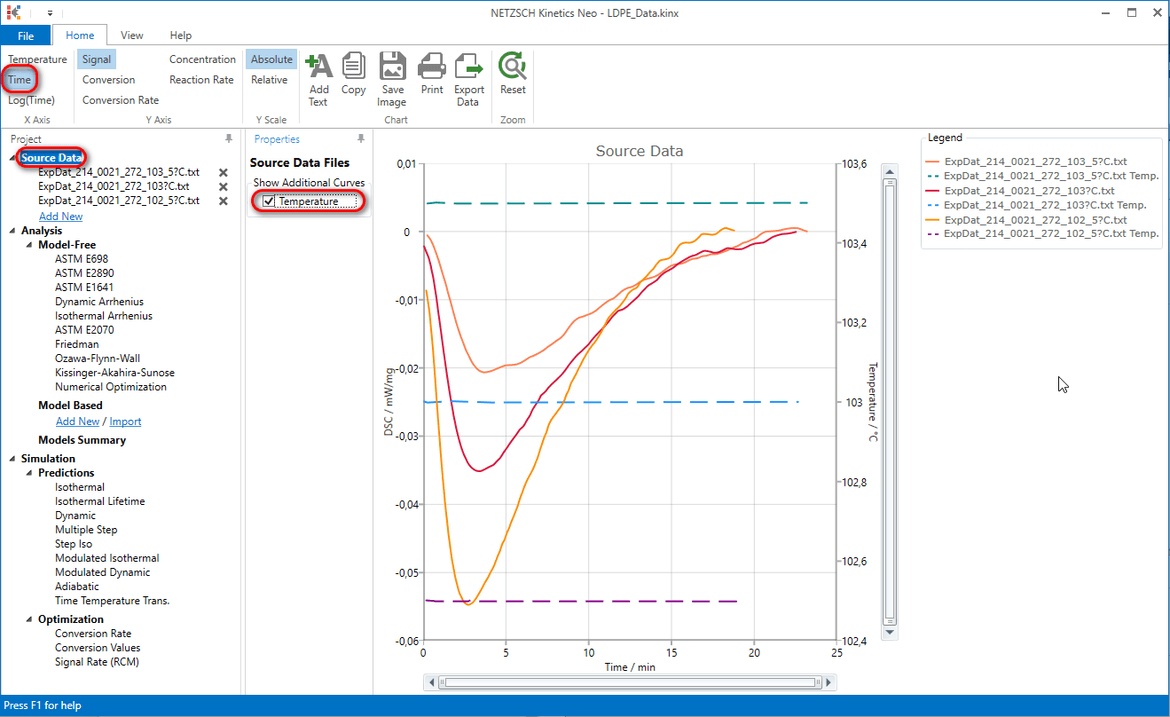
Here three isothermal measurements are done for the isothermal crystallization of LDPE:
- 102.5 °C
- 103.0 °C
- 103.5 °C.
NOTE: If you work with your own data, and these data do not start from time=0, then please select the range of isothermal data only where the left border of selected range corresponds to the reaction start.
Analysis of Isothermal Data According to ASTM E2070
5. In the left tree select Analysis → Model-Free → ASTM E2070.
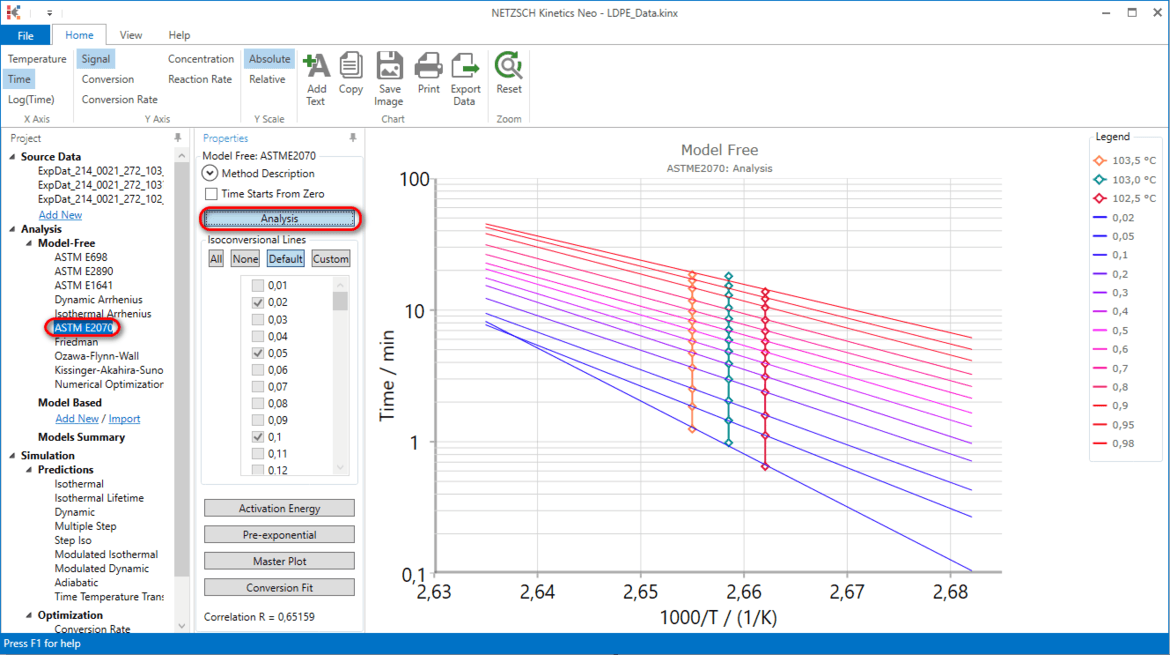
Analysis shows graphic Log of time-to-conversion vs inverse temperature for the points with the same conversion from the different measurements. The graphic shown as the straight line for each conversion value.
For isothermal chemical reactions the slope of these lines is positive, because the reaction rate increases with the temperature. But here for isothermal crystallization the slope of the straight lines is negative because crystallization rate decreases with temperature.
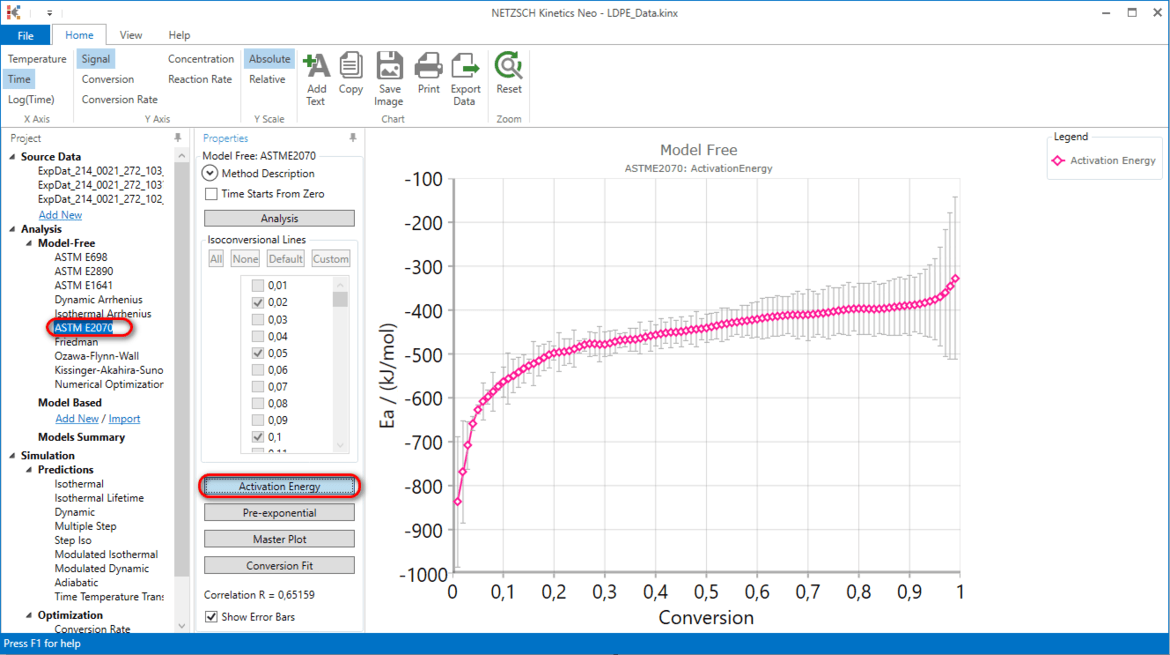
6. Show activation energy and pre-exponential factor, which are calculated according to ASTM E2070.
Click on "Activation Energy" button to show Activation Energy chart.
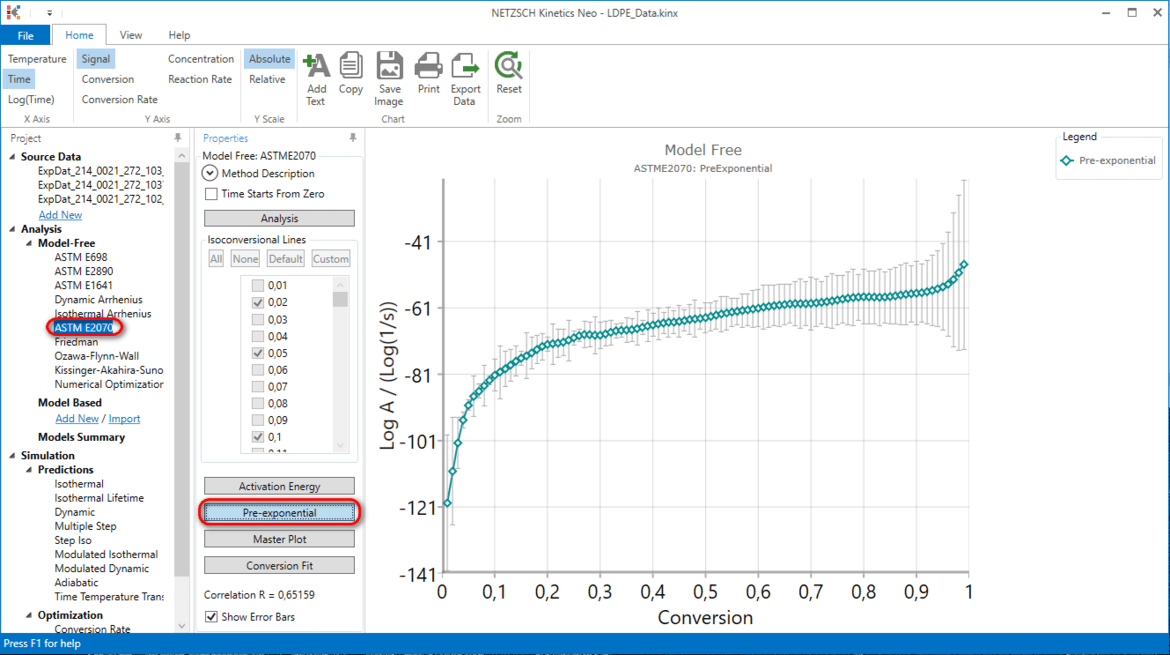
Click on "Pre-exponential" button to show Pre-exponential chart.
Here both of these values are negative because crystallization rate decreases with temperature.
Half-Crystallization Time
For half-crystallization time you can use the same item in the left tree view, but only for the conversion value of 0.5, which corresponds to 50% of crystallization.
In the left tree please select Analysis → Model-Free → ASTM E2070.
Then in the Properties Panel select Custom for Isoconversional Lines and in the table of conversion values check only one value 0.5 like it is marked on the next figure:
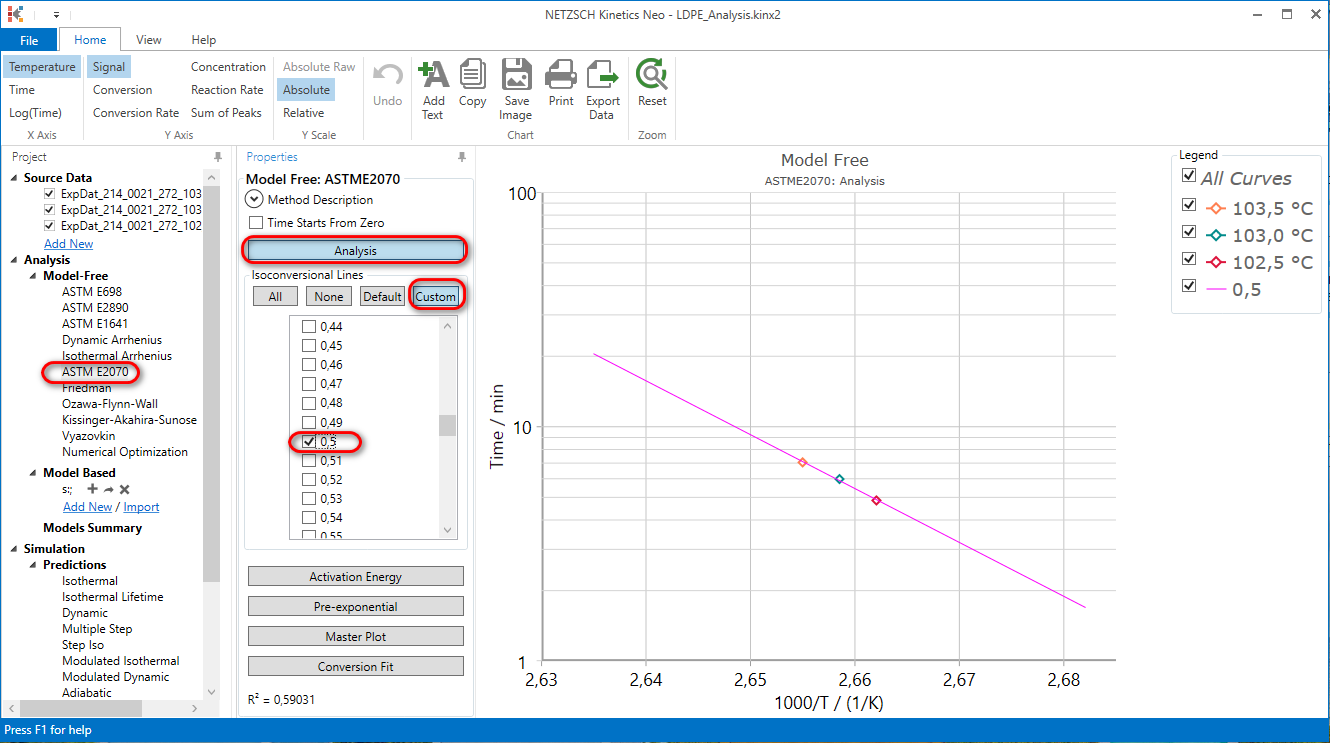
The points on this figure corresponds to the measured half-crystallization time at different isothermal measurements. The straight line can be used for the prediction like it is presented in the next chapter.
The same analysis method can be used for calculation of the crystallization time for the other conversion values, if they are selected in the table of Isoconversional Lines. This table has values from 0.01 to 0.99 corresponding to the percentage values from 1% to 99% of conversion.
Isothermal Lifetime Prediction
7. Select prediction and set prediction parameters.
In the left tree select Simulation → Prediction → Isothermal Lifetime.
In the prediction properties panel select ASTM E2070 model.
Set the prediction parameters:
- Minimal Temperature to 100 °C
- Maximal Temperature to 104 °C
- Temperature Step=1 min
- Time for prediction is 100 min.
8. Press Calculate.

This graphic shows crystallization time for each given degree of crystallization for different temperatures. Each line presents one selected degree of conversion. E.g. the upper line here means the time for crystallization of 98% at different temperatures.
Temperatures are shown in the legend.
We see that:
- 98% of crystallization at 100 °C happens after 9 min
- 98% of crystallization at 104 °C is reached after 40 min.
In order to see the predicted time values, please use Export Data on the main top toolbar.