My Data Are Incomplete. Can I Still Analyze Them?
IMPORTANT: this guide will be reworked soon to reflect important changes made in the version 3 .0 of Kinetics Neo.
Contents
I. Prepare (Simulate) Incomplete Data
IMPORTANT: We do not recommend to analyze data, where measured reaction is not complete. We recommend to perform measurements where both begin and end of reaction are well measured.
However, it is not always possible. For example, for heating measurements of curing process the decomposition reaction sometimes starts before curing is finished. Here is example of rough evaluation of incomplete data. The kinetic results are enabled only in the temperature range where reaction was measured.
I. Prepare (Simulate) Incomplete Data
This is preliminary step just to produce incomplete data. In real life the data should be obtained from the experiment.
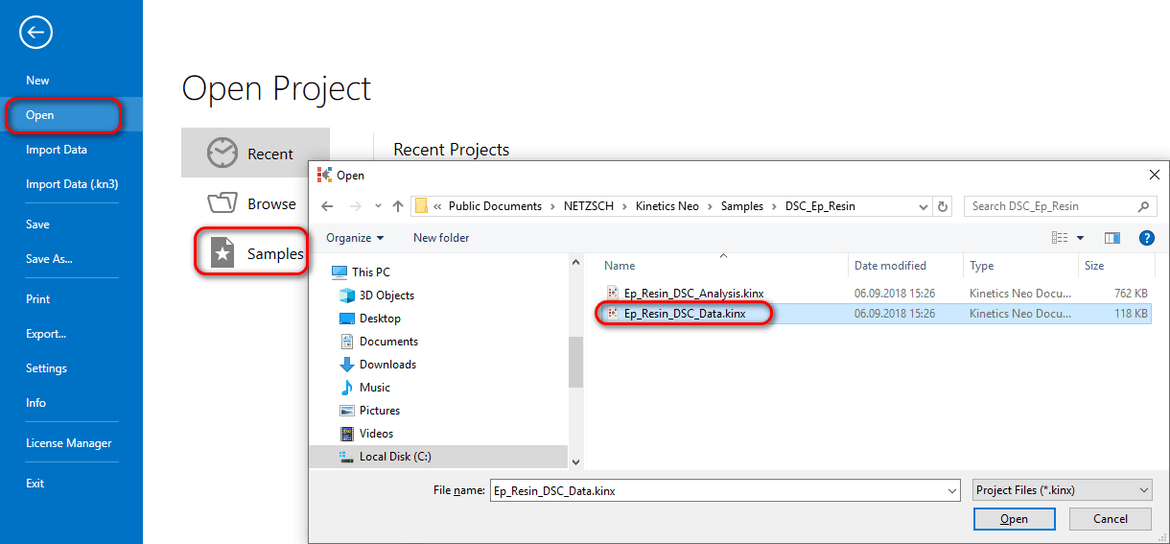
- In Kinetics Neo open example Ep_Resin_DSC_Data.kinx2:
2. In the left tree in Source Data section select File Ep_Res20.txt. Set:
- Range from 100°C to 200°C,
- Baseline None,
and click OK
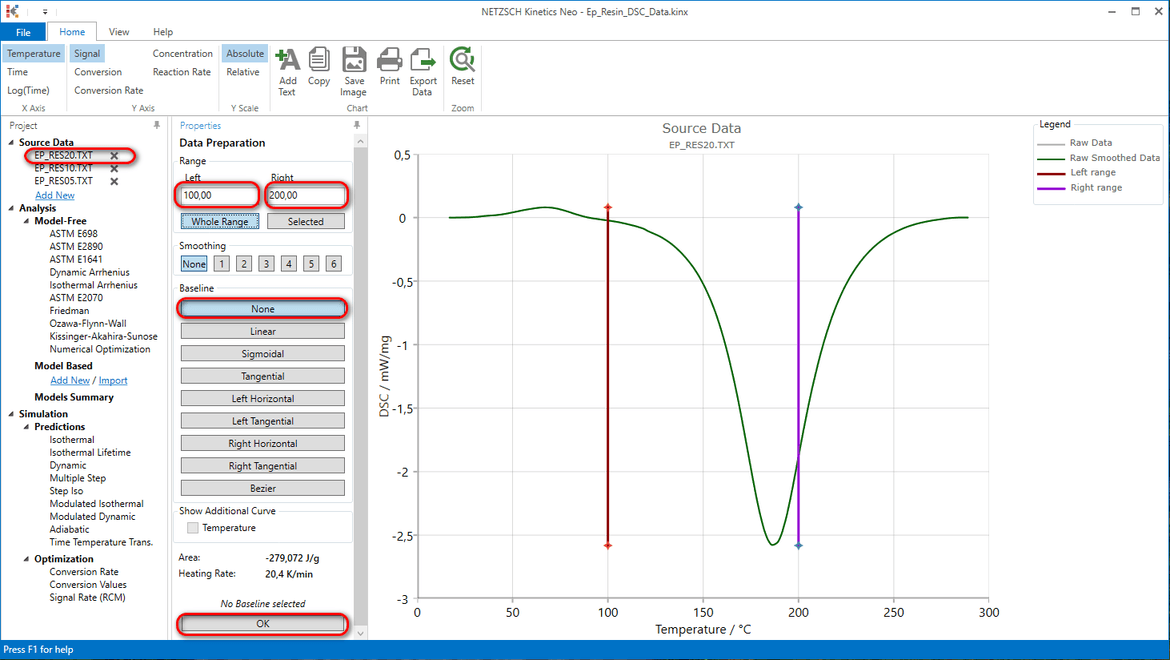
Here the measured peak area 279 J/g is written on the Properties panel after baseline types.
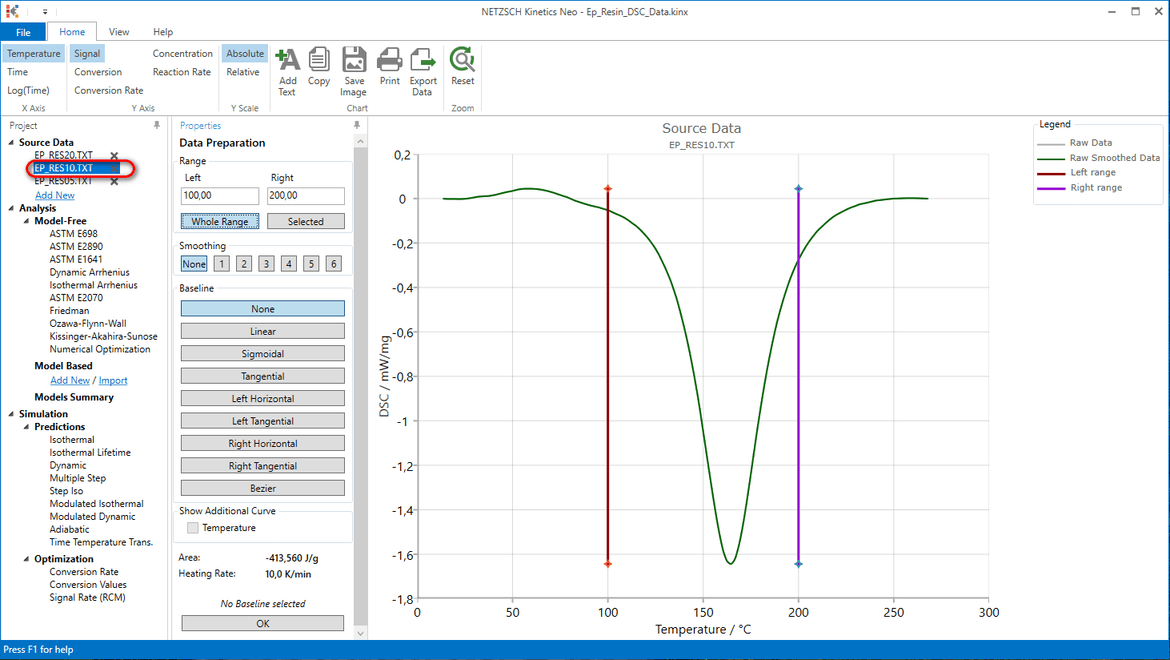
3. Repeat the same for file Ep_Res10.txt
4. Repeat the same for file Ep_Res05.txt
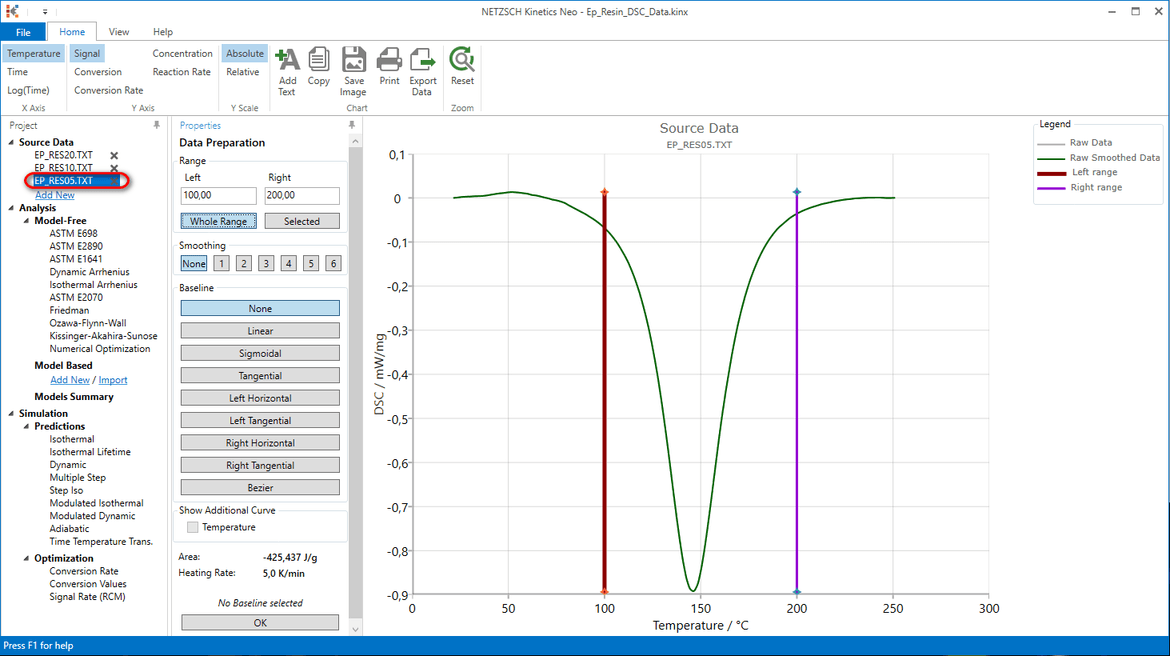
Data for analysis:
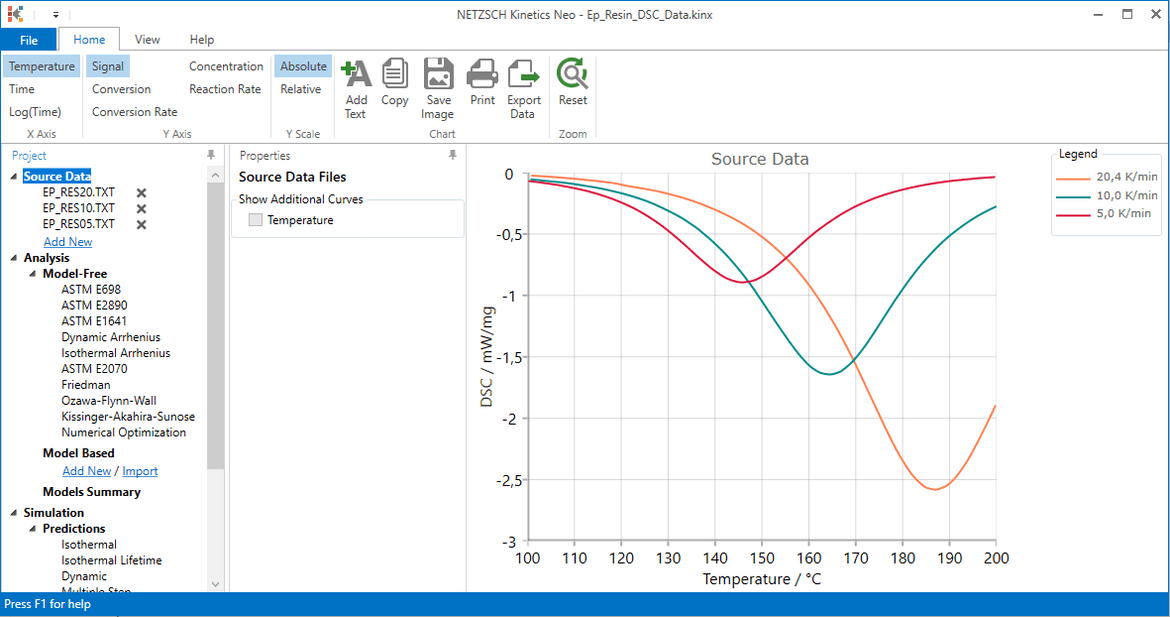
Now the data are prepared. Each curve contains data from the begin of curing to the main peak, main peak itself and the part of the curve after main peak.
If the measured data do not contain peak then the such data can not be analyzed.
II. Model Free Analysis
If the data are not measured completely then the total effect is unknown. For DSC data the total effect is the enthalpy of thermal effect which is calculated as the peak area. If the enthalpy of the total effect is unknown then the conversion can not be calculated correctly, and the Model-free methods based on the defined conversion values, may not be used.
Methods of:
- Friedman
- Ozawa-Flynn-Wall
- Kissinger-Akahira-Sunose
- ASTM 1641
- numerical method
may not be usedfor incomplete data.
Only two Model-free methods may be used:
- ASTM E698
- ASTM E2890
because they use points of maximum rate and do not use points with defined conversion.
5. Method ASTM E698
Select ASTM E698 in the left tree panel in the Model-Free section.
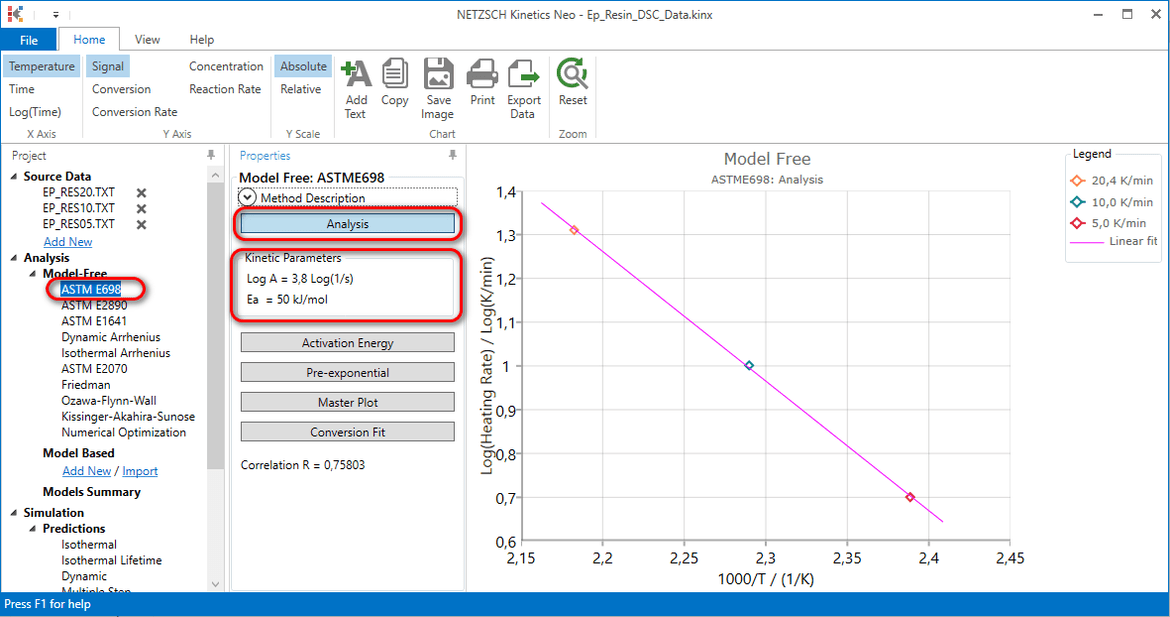
The maximum point from each measurement is shown on this graph. Activation energy and pre-exponential factor are calculated from the slope and intersect of the straight line by Ozawa formula. This method can evaluate only activation energy for the main peak. This method is not suitable for the complex reactions with several maxima points.
6. Method ASTM E2890.
Select ASTM E2890 in the left tree panel in the Model-Free section.
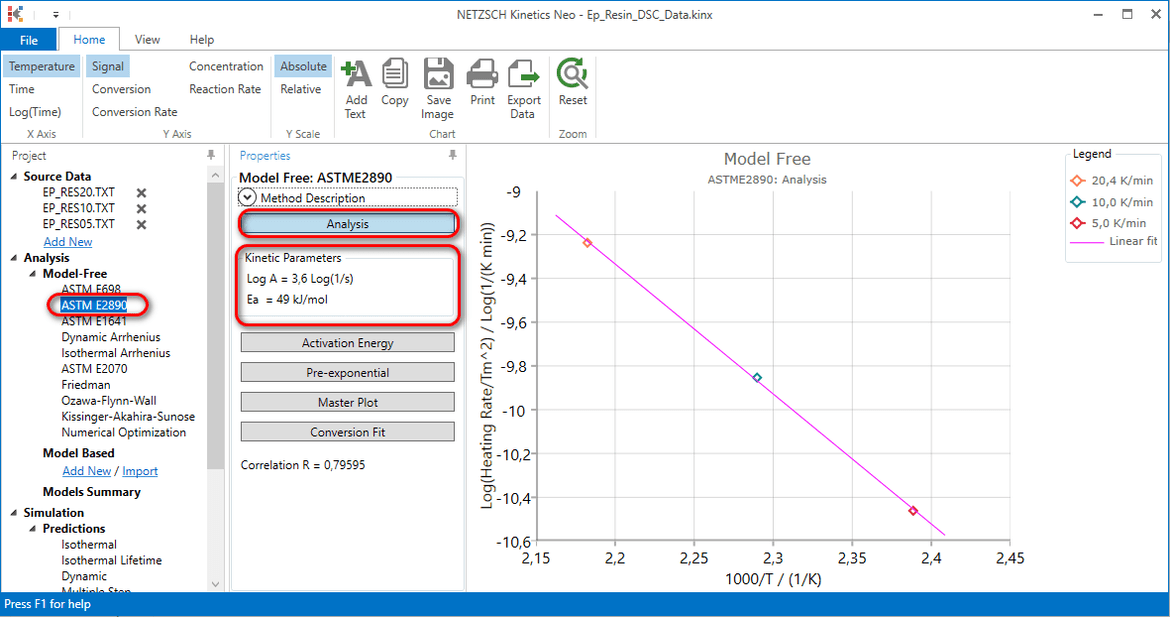
The maximum point from each measurement is shown on this graph. Activation energy and pre-exponential factor are calculated from the slope and intersect of the straight line by Kissinger Method. This method can evaluate only activation energy for the main peak. This method is not suitable for the complex reactions with several maxima points.
III. Model Based Analysis
Model-based analysis can be helpful for the measurements which are incomplete. But the model will work only in the temperature range, where experimental data are present. Outside of this range the predictions can be incorrect because experimental data do not contain information about any reaction steps outside this range.
7. Create new kinetic model.
In the left tree select Add new in Model Based section
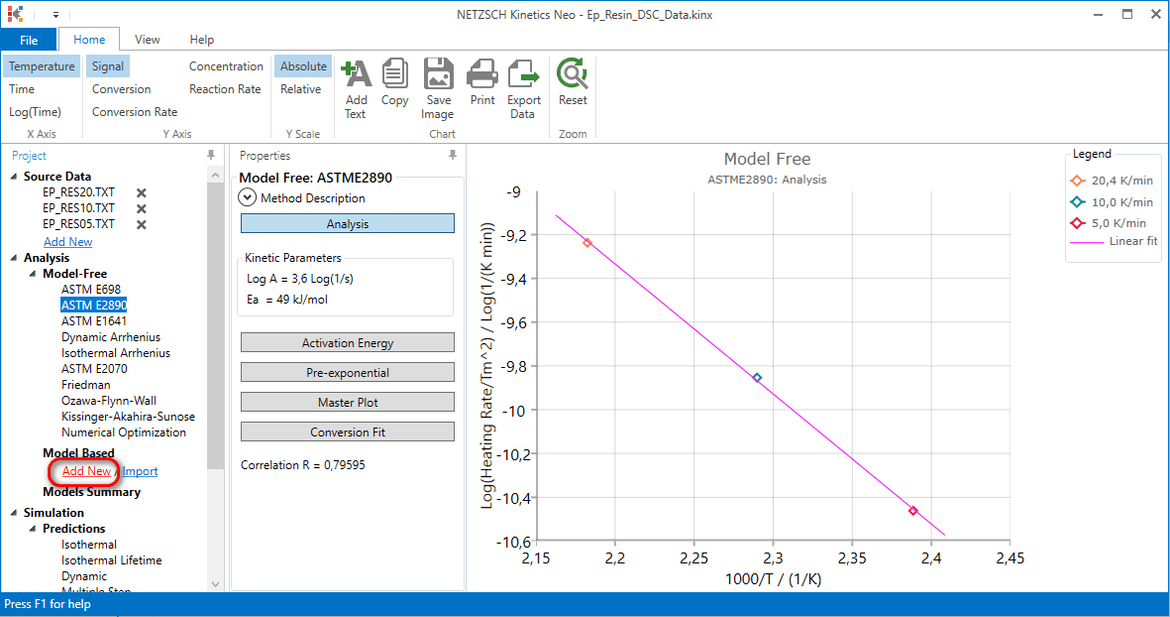
Result:
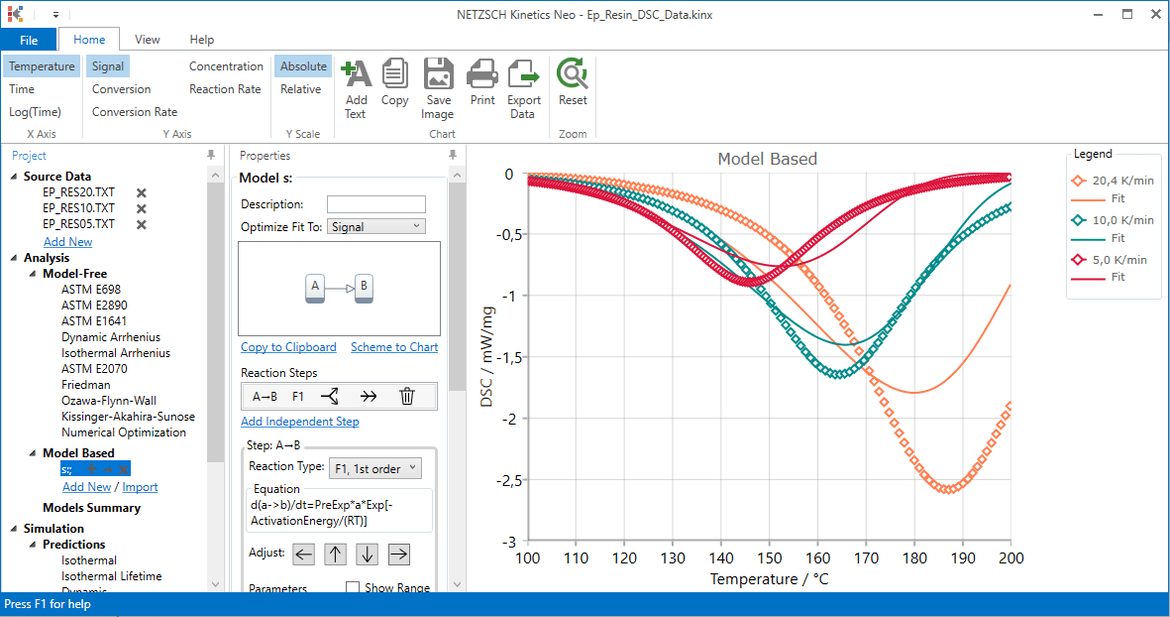
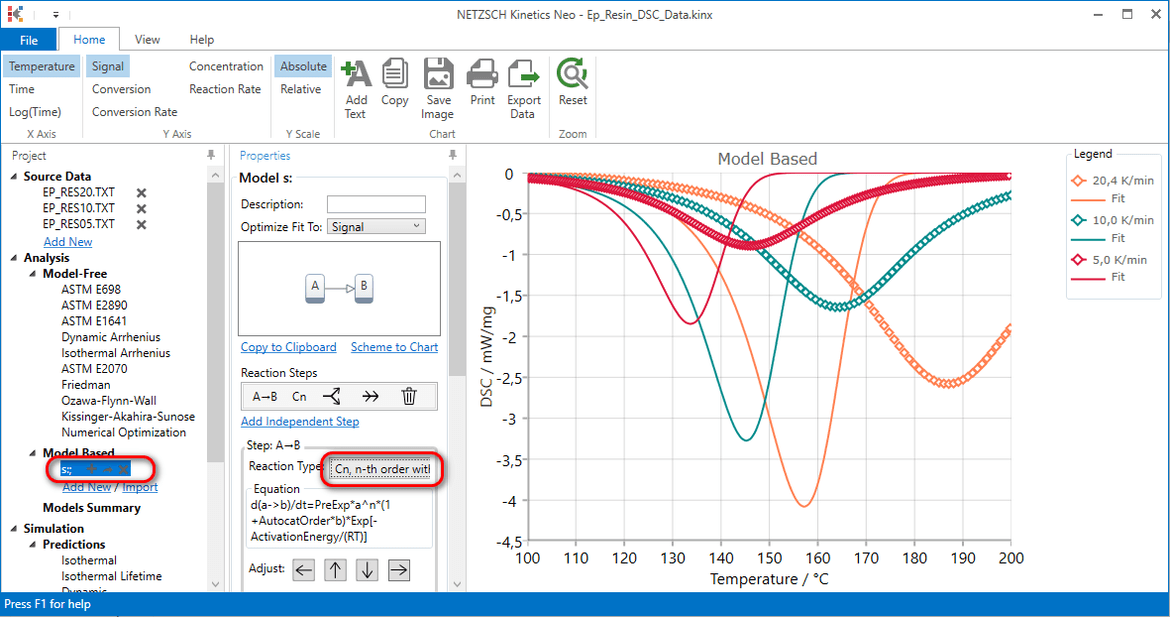
7. Select correct reaction type
In the Properties panel select Cn, nth order with autocatalysis for Reaction type:
9. Set total effect value manually.
In the Properties panel, section Area, find the highest value. Here is 425.
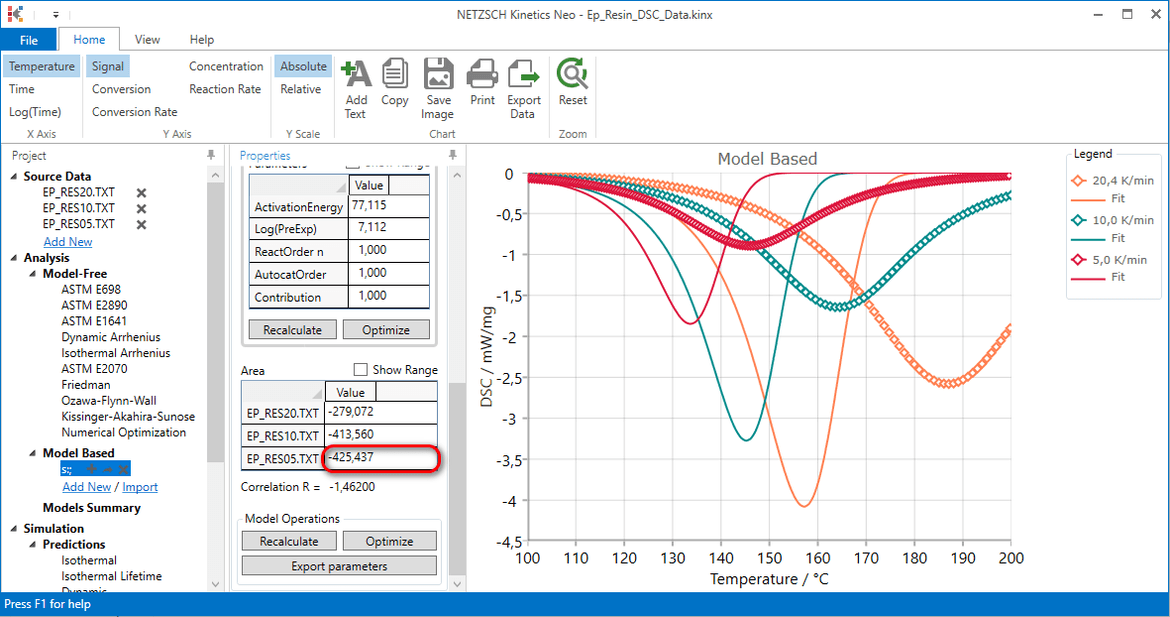
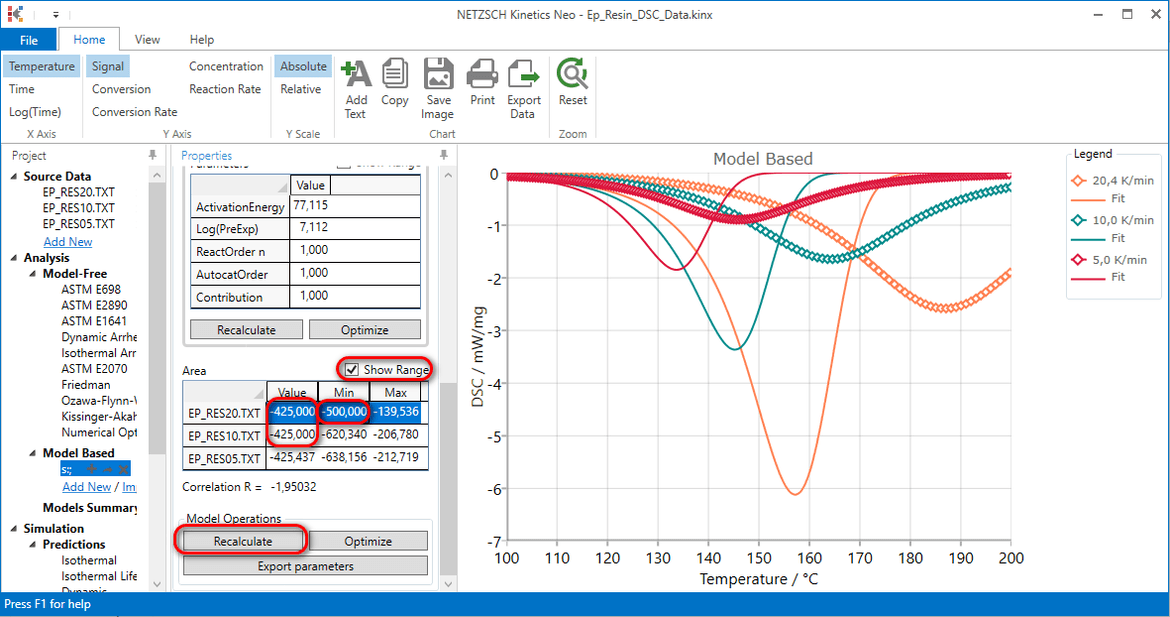
Set this maximal value for two other curves. If necessary, check Show range and set minimum value much below -425. Here it is set to -500. Click on Recalculate in Model Operation section.
10. Optimize kinetic parameters
In Properties panel scroll down and press Optimize in Model Operation section.
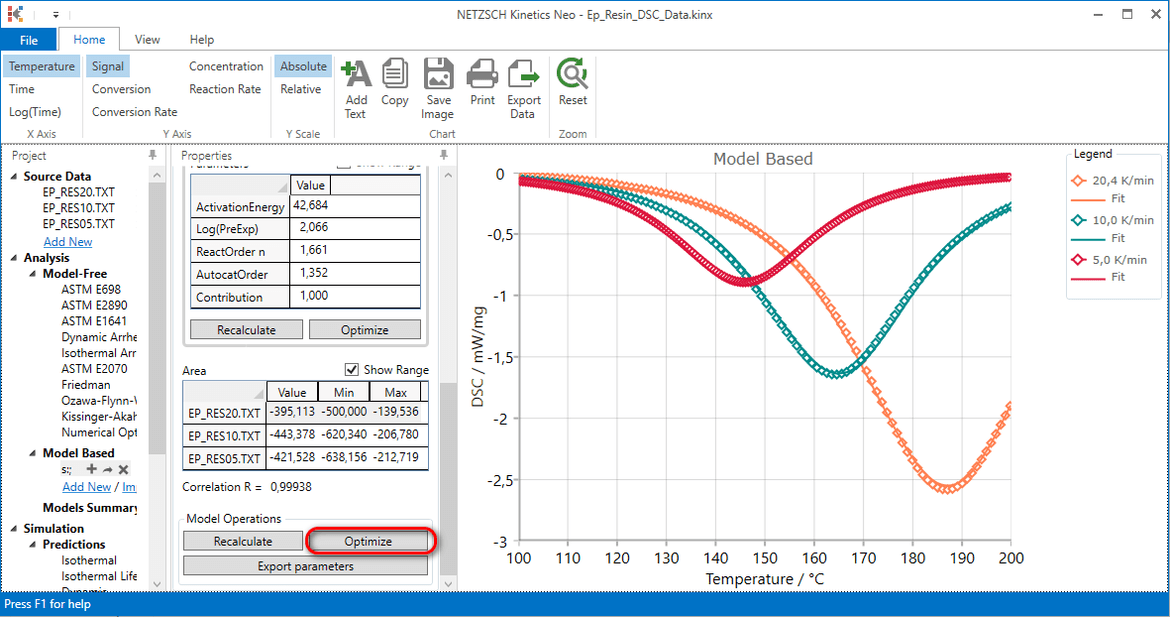
Now the kinetic model is created for the incomplete measured data. This model can be used only in the temperature range between 100°C and 200°C where experimental data are present.
This model uses the optimized values of peak area. For example, for 20K/min the optimized peak area according to the model is 395 J/g, whereas the experimental peak area between 100 °C and 200 °C is only 279 J/g (see section2). Rest enthalpy 116 J/g is not measured in experiment, but can be calculated from the kinetic model.
11. Calculate conversion for 5,10 and 20K/min at 200°C
In left tree select Dynamic in Prediction section. In Properties panel set parameters for dynamic predictions like in picture and click on Calculate. Select Temperature and Conversion in the toolbar.
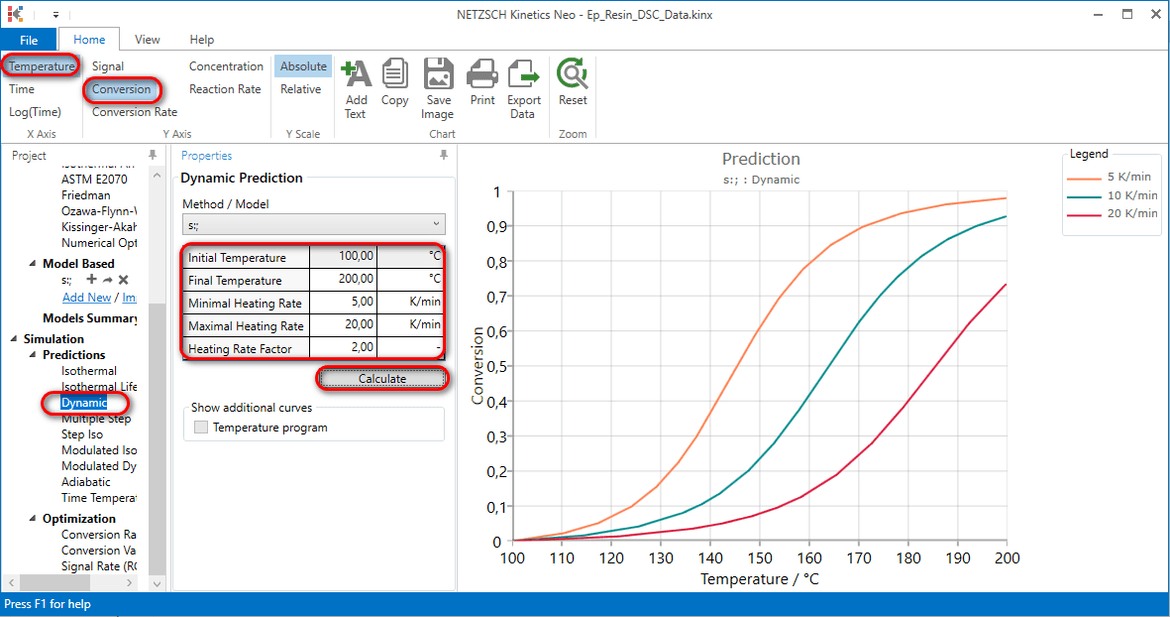
This is the conversion for incomplete measurements. Here Measurement 20K/min contains experimental data only until 74% of conversion.