Time-Temperature-Transition (Time-Temperature-Transformation) Diagram for Polymers
Time-temperature-transition (time-temperature-transformation) or TTT diagram shows time dependence of material transformation at given temperature.
The diagram has horizontal logarithmic time axis and vertical temperature axis.
TTT diagram is used for isothermal processes where the transformation of material happens.
In the kinetics of polymers these processes are curing and crystallization and the transformations are vitrification and gelation.
Example
How to find the time of material transformation at isothermal conditions on TTT diagram? For selected temperature on vertical axis draw the horizontal line and find the point of crossing with transformation curve. The time value for this point is the transformation time for given temperature. For curing diagram, the transformation curves show gelation and vitrification.
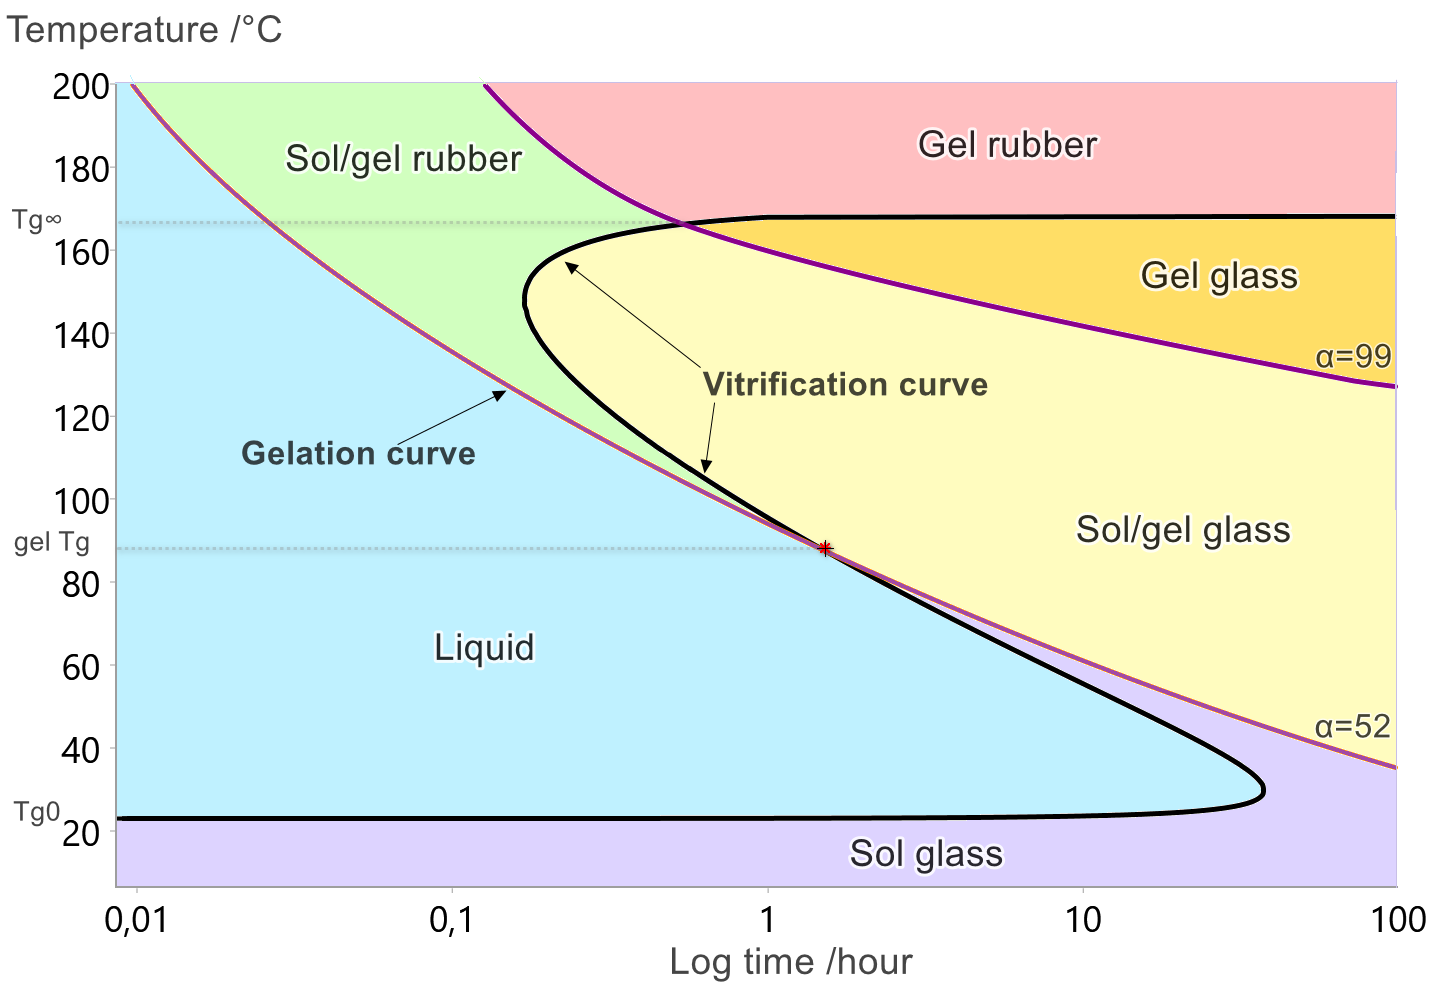
Gelation is the irreversible transformation of a liquid resin into a viscoelastic gel, marked by a sharp rise in viscosity and the formation of an infinite molecular network.
Vitrification is a gradual, thermo-reversible transition where the resin shifts from a liquid or rubbery to a glassy state.
Tg0 : glass transition temperature of the uncured resin
Tg∞: glass transition temperature of the fully cured resin
α: degree of cure
gel Tg: It is the temperature at the intersection of the gelation curve and the vitrification curve in the TTT diagram.
User Guides and Applications
Learn Kinetics: DSC Curing with Diffusion Control
Application Note Time-Temperature-Transformation (TTT) Diagramm of Epoxy Resin