Pyrolysis Kinetics of Milled Olive Stone Residue
T. Asimakidou, K. Chrissafis. Aristotle University of Thessaloniki, Greece
Sample
As representative among biomass feed stocks olive stones samples were supplied by Pharmagnose S.A.which is a company based in Athens, Greece, specialized in natural ingredients research. The olive stones were selected from crops in the Central Greece region after the oil extraction, and they were milled and sieved to succeed a particle size≤200μm. In addition, the olive stones were air dried at 100oC for 3h.
Experimental Tests
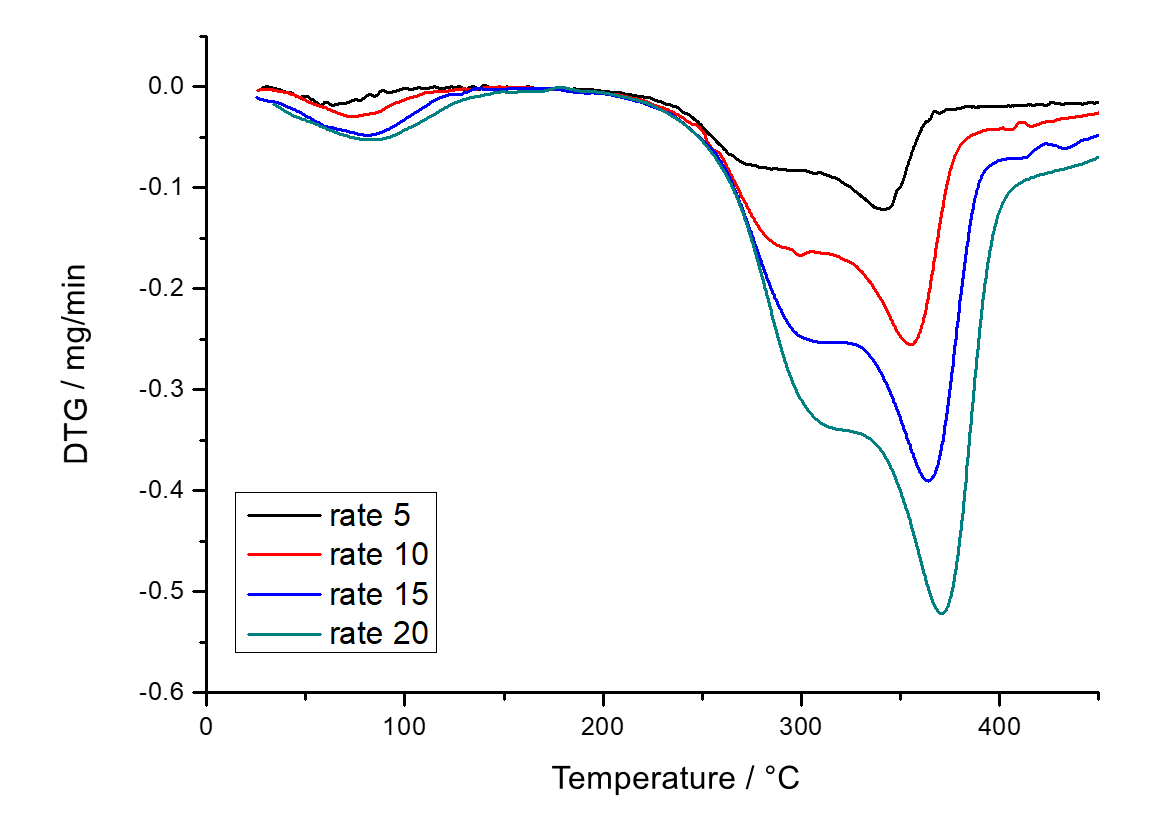
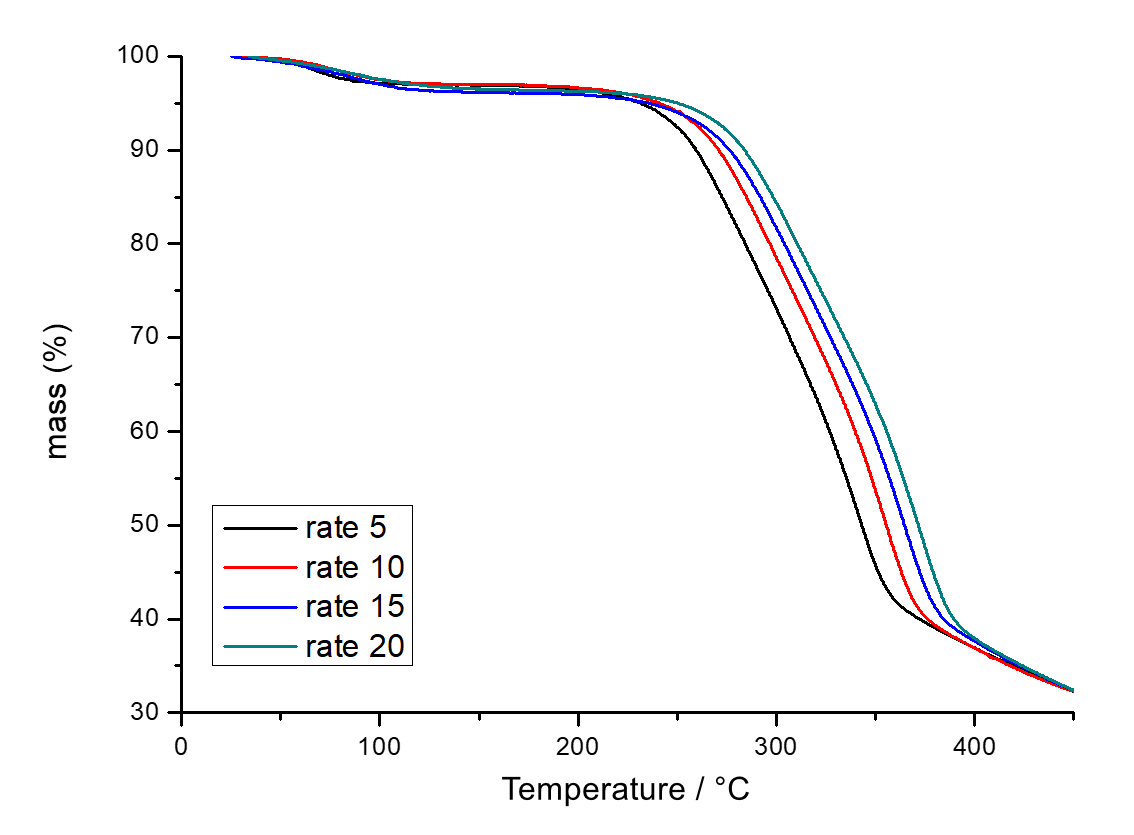
Thermogravimetric measurements were performed using a TG-DTA instrument. Approximately 3-4 mg of each sample was placed in alumina crucibles while an empty alumina crucible was used as reference. Then the samples were heated from 25oC to 800oC in N2 atmosphere at heating rates of 5, 10, 15, 20oC/min. Thermographs of mass loss vs Temperature and Derivative thermogravimetric curves were obtained indicating the decomposition steps and the maximum mass loss of each sample. The kinetic study was carried out via the NETZSCH Kinetics Neo software.
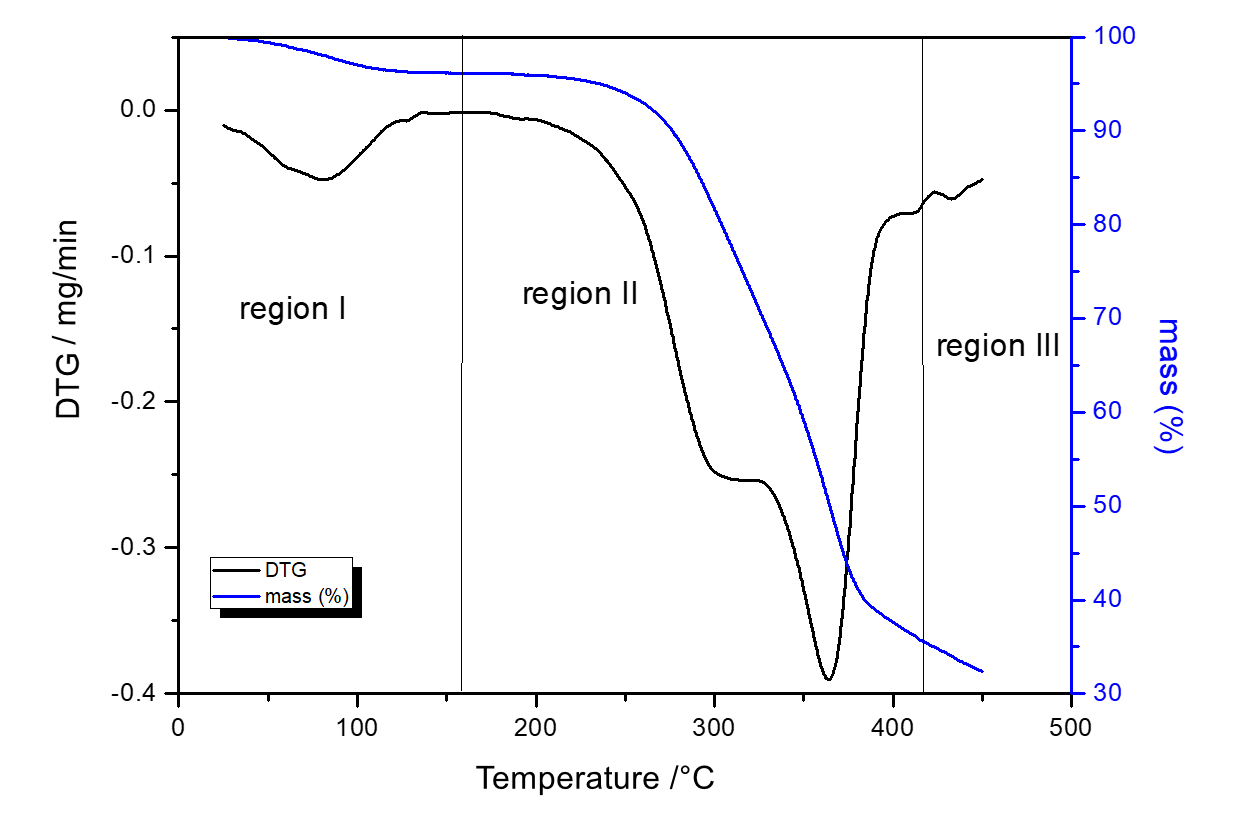
Fig.1 illustrates the thermogravimetric (TGA) and Derivative thermogravi-metric curve (DTG) of the residual biomass of olive stone sample. It was confirmed that the thermal decomposition of the olive stone achieved in three areas of mass loss: moisture evaporation, main devolatilization and slight devolatilization. The first occurs up to 107oC corresponding to the elimination of the “remaining” moisture and is accompanied by a mass loss of 3.8% wt.With further heating, follows a second mass loss in the temperature range from 170οC to the end of the process in which take place the decomposition of the lignocelluloses materials: hemicelluloses,cellulose and lignintakes place. Indicatively for a rate of 10oC/min the decomposition of the residual biomass of olive stone samples is represented by two peaks, with maximum weight loss rates at 362oC as depicted by the DTG curve.Τhe formation of the peaks in the DTG curve is a result of the sum of the contributions by all three constituents assigned to the three lignocelluloses components [1].
Model-Free and Model Fitting Methods - Reaction Mechanisms for Olive Stone Pyrolysis
The TGA profile for therate 10oC/min in Fig.1 indicates that the pyrolysis process has not be completed up to 450oC proceeding slowly up to 800oC. It should be clarified that the first mass loss, region I, related to moisture removal was not taken into account and was not included in the data to be processed as this stage has no particular value in kinetic analysis. Nevertheless, for the kinetic study of olive stone degradation the applied model was restricted in region II, overlooking the almost linear part of the curve above 450oC (region III) which interferes the accuracy of the fitting.
Model-Free Analysis
The kinetic parameters and the estimation of the reaction mechanism function for both model free and model fitting methods were determined via NETZSCH Kinetics Neo software. The model-free methods were applied to experimental data aiming to determine Eα and logA for each degree of conversion, corresponding to the decomposition process of olive stone. Fig.3 illustrates the Eα and logA as a function of the degree of conversion (α), using the Vyazovkin isoconversional method.
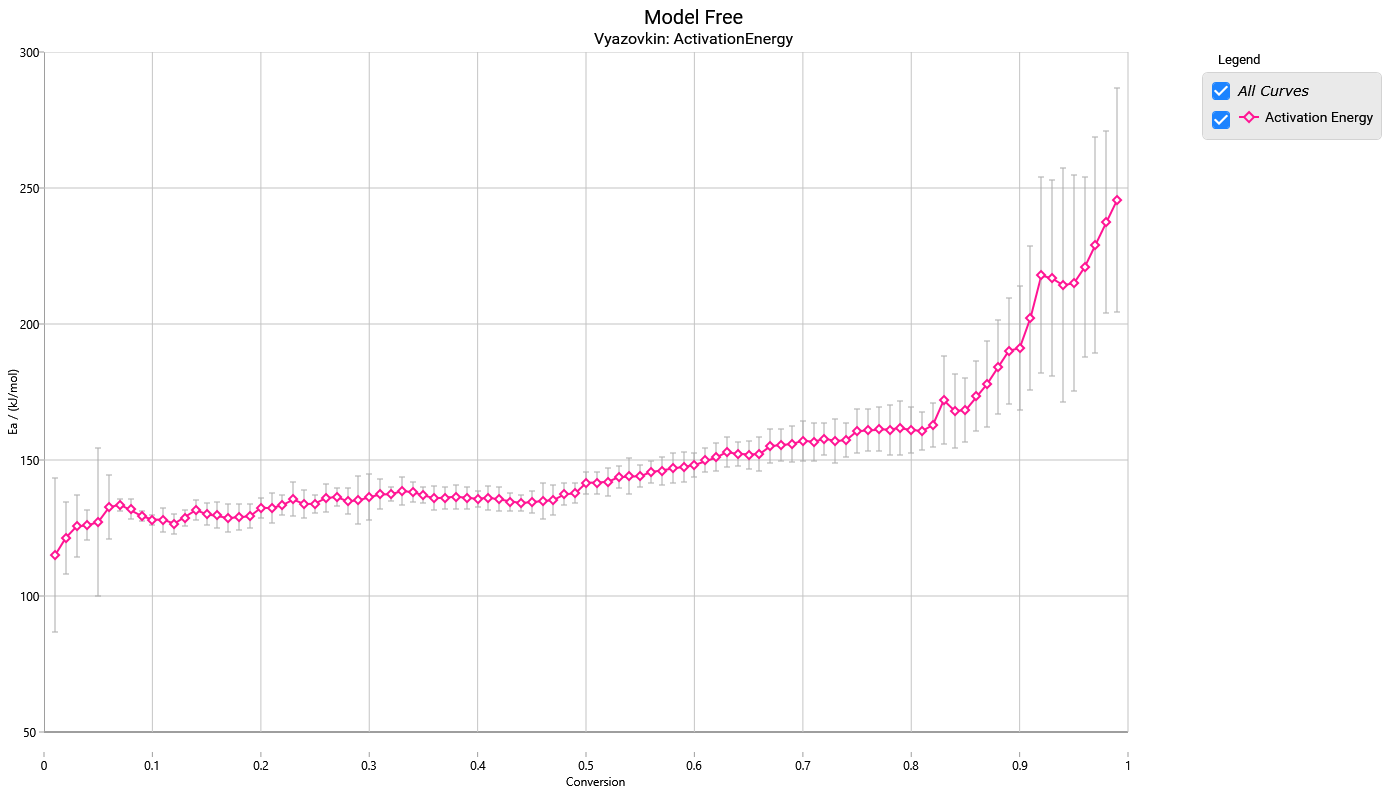
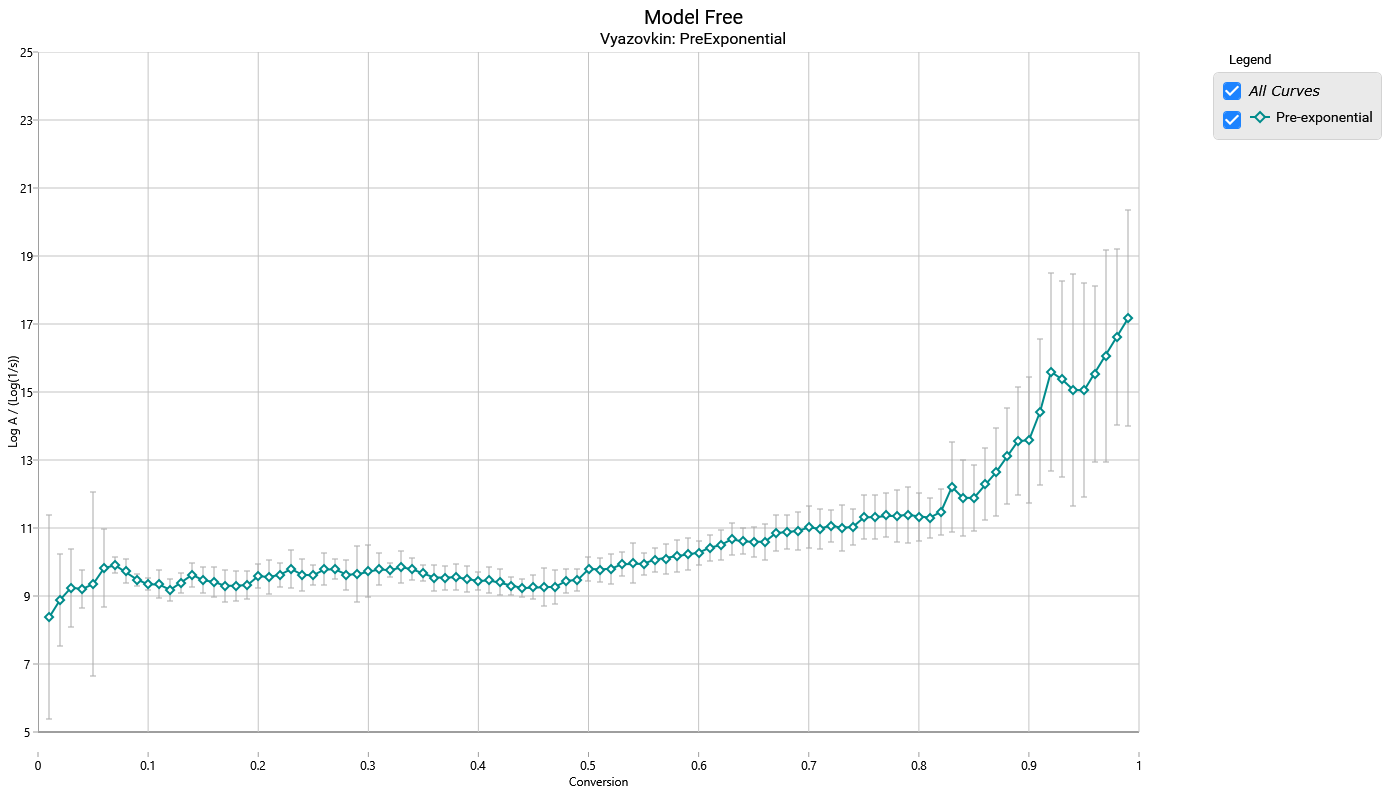
From the observation of Fig.3 the presence of several regions in both kinetic parameters variation for the olive stone decomposition sample are clearly visible. The first region corresponds to the degradation mainly of hemicellulose component, which is the least-stable component and undergoing rapid thermal decomposition and a part of cellulose. It is characterized by an increase of Eα values up to 139 kJ/mol while the logA value estimated up to 9.7 according to VYA method for conversion up to 0.5. In the next step, higher values of Eα are obtained, ranging between 140-168 kJ/mol, for conversion levels extended from 0.5 to 0.85 which probably related to the degradation of the major part of cellulose component and also, a part of lignin. The logA values in this conversion range calculated at 9.5-10.5. For conversion values above 0.85 a sudden increase in Eαand logA values is visible, as a result of the increasing aromatic character of the lignin derived bio-char when higher temperatures are reached. Here the variation in Eα at different conversion values reveals that pyrolysis of olive stone is a complex process.
Model Fitting Analysis
Model fitting (or "Model-Based") methods involve fitting of Conversion-Temperature curves by different models and simultaneous determination of the effective Ea and the logA [2]. Model fitting methods assume that the reaction has several steps, each of which has its own kinetic equation while the kinetic parameters of each step are constant values. Determination of the kinetic triplet (Ea, A, f(a)) in biomass pyrolysis using model fitting methods is in general a difficult “process” because the required information about the interaction of steps is not directlypresented in the experimental data [3].
In our case, for the determination of the kinetic triplet (Ea, A, f(a)) in olive stone pyrolysis process various reaction models were considered for the fitting of the experimental data at different heating rates. Taking into consideration that the biomass degradation is a highly complex process presenting two overlapping mass loss areas and the results of the VYA method revealed that the pyrolysis should be described at least by two mechanisms.
Considering that the materials of this category consist of three main components which decomposed independently but in overlapping temperature areas we primary select the condition of at least two independent-parallel degradation mechanisms. Additionally, since the three-component decomposition mechanism coexists with possible interactions between the reactants increasing its complexity, the optimum way for identification is the use of mathematical equations that have the lowest number of unknowns. In other complex systems, the existence of many unknowns provides many combinations with particularly satisfactory identification results. This approach does not mean that the best combination has the most appropriate physical significance. For this reason, in complex systems, we try to apply the simplest mathematical equations.
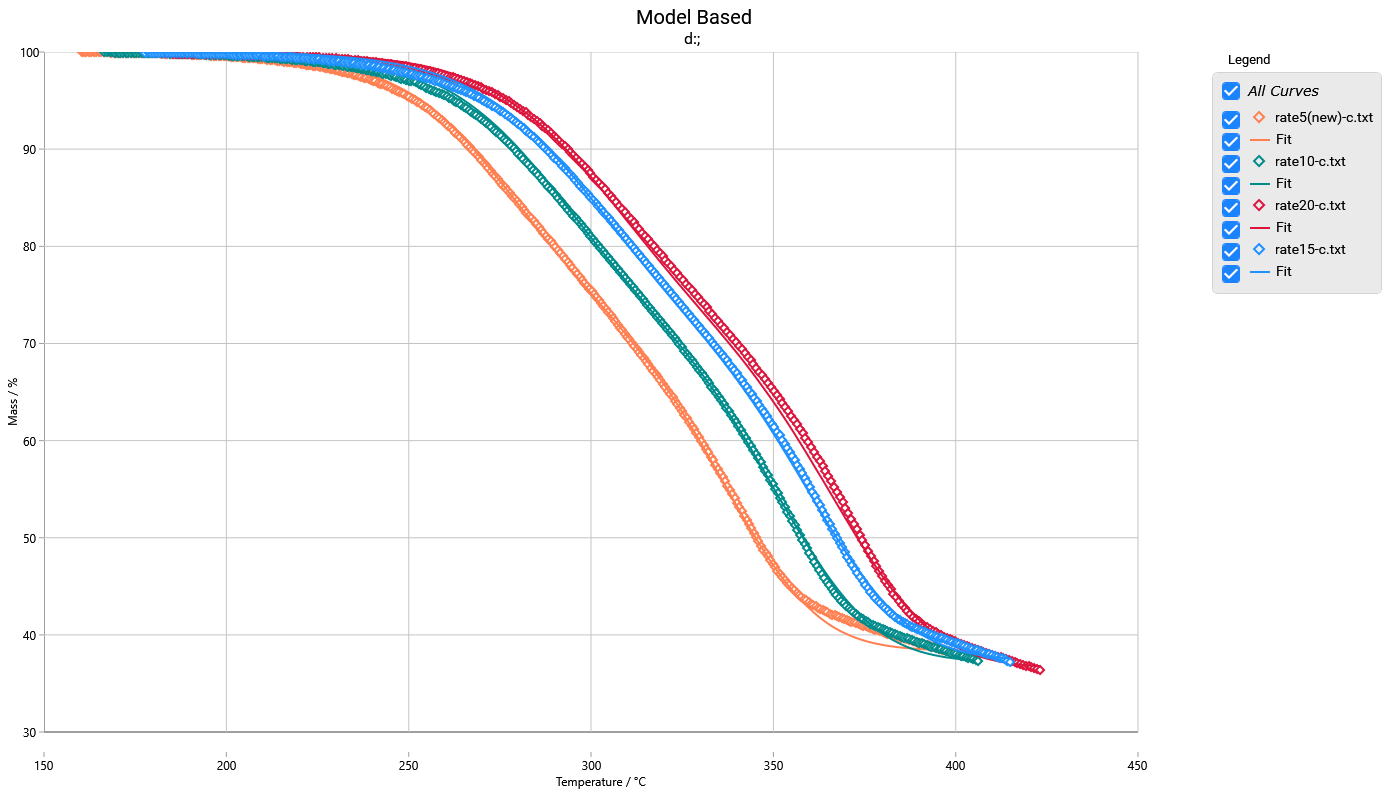
Fig.4 illustrates the mass loss-T data and the corresponding fitting curves of olive stone sample at four different heating rates for a two independent parallel reaction mechanism and a three independent parallel reaction one, both obeying n-th order with Fn reaction models (Fn code). Although the quality of the two independent parallel reaction mechanisms is considered satisfactory (R2= 0.99974) there are divergences, particularly obvious at the end of the process thus, the assumption of the two independent parallel reaction mechanism was not qualified appropriate for describing the process. The corresponding parameters obtained by the aforementioned model are summarized in Table 1.
Table 1. Kinetic parameters for the two independent reaction mechanisms
| Reaction model | Activation energy Ea (kJ/mol) | Pre-exponential factor logA, A(1/s) | Reaction order (n) | Contribution | R2 | |
| Step A→B | Fn | 130 | 10.04 | 1.29 | 0.36 | 0.99974 | |
| Step B→C | Fn | 150.4 | 10.53 | 1.26 | 0.63 | ||
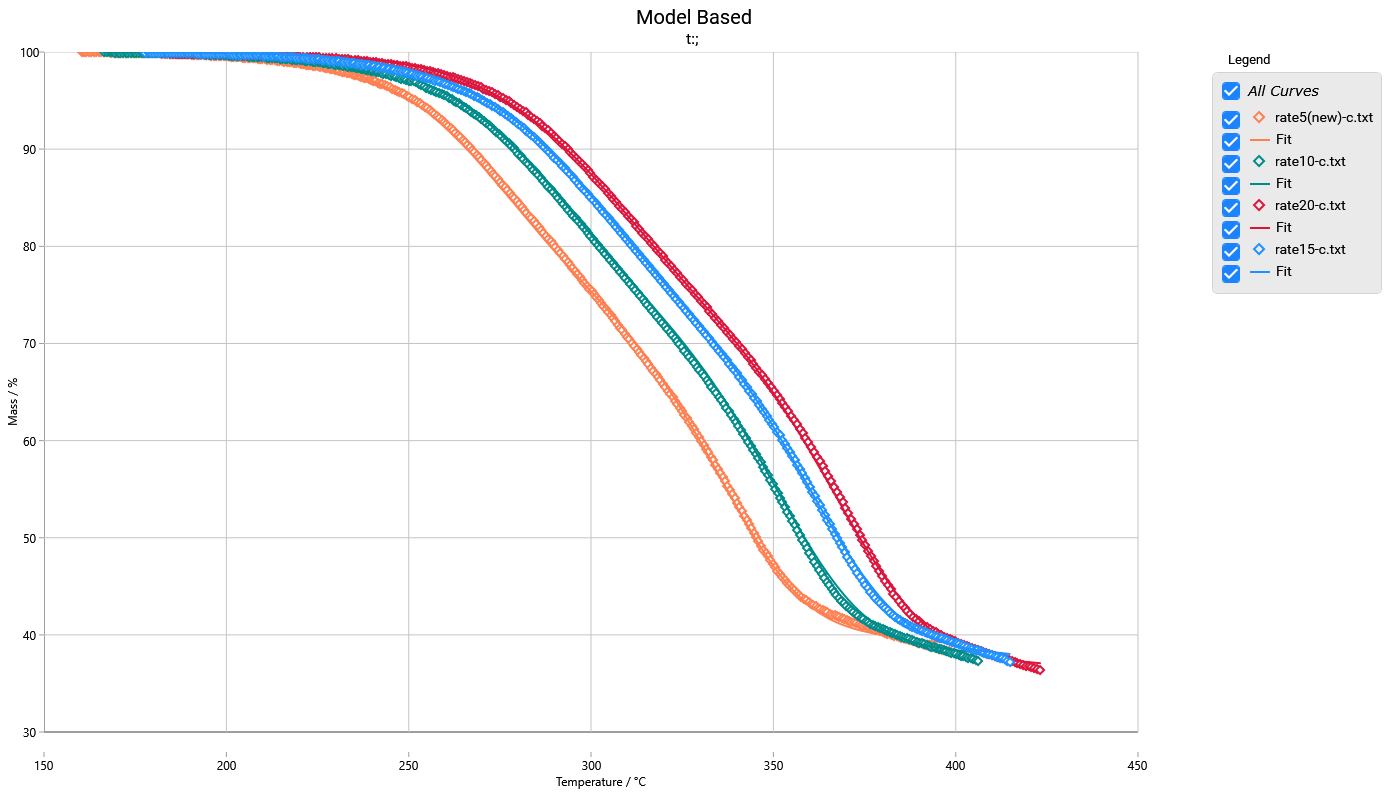
The reaction model that describes better the experimental data of olive stone sample can be expressed by three independentparallel reactions, obeying the n-th order (Fn) and described by the f(α)=(1-α)n equation. Especially the established three independent parallel reaction model analyses only the decomposition of the main components of olive stone, hemicelluloses, cellulose and lignin. The results of model fitting analysis, which concludes the best selected model (Fn) and three independent reaction mechanisms, are presented in Table 2.
Table 2. Kinetic parameters for the three independent reaction mechanisms
| Reaction model | Activation energy Ea (kJ/mol) | Pre-exponential factor logA | Reaction order (n) | Contribution | R2 | ||
| Step A→B | Fn | 118.9 | 8.96 | 1.32 | 0.32 | 0.99998 | |
| Step C→D | Fn | 143.7 | 9.94 | 0.84 | 0.45 | ||
Step E→F | Fn | 217.6 | 14.67 | 5.47 | 0.22 | ||
Hemicellulose is constituted by sugar monomers and short-chain hetero polysaccharides and presents an amorphous and branched structure, such as xylan while the shorter chain formation of this component results in lower thermal stability. Cellulose is characterized as poly-crystal component with β 1,4-glycosidic bonds and with higher thermal stability [4]. On the other hand lignin is the most stable component due to the aromatic rings constituents and covers a large temperature range to the end of the process [5]. In accordance with the aforementioned information, the first reaction (AàB) with effective Eα=118.9kJ/mol, logA=8.96 and contribution 0.32 is associated with the degradation of hemicelluloses component, while the second reaction (CàD) with effective Ea=143.7 kJ/mol, logA=9.94 and contribution 0.45 is attributed to the degradation of cellulose. The effective Eα and the contribution of the third reaction (ΕàF) corresponds to Eα=217.6 kJ/mol, logA=4.67 and 0.22 respectively, suggesting that this reaction is related to a part of lignin degradation. With this way the Fn model simplified the complex nature of the olive stone degradation.
The rate equations with respect to each reaction, considering the Fnkinetic model for three reaction mechanisms can be presented as:
Step: A → B
d(a→b)/dt = A1 an1exp[-Ea1/RT]
Step: C → D
d(c→d)/dt = A2 cn2exp[-Ea2/RT]
Step: E → F
d(e→f)/dt = A3 en3exp[-Ea3/RT]
The a, c and e elements represent the concentration of reactants:
- a → concentration of A
- c → concentration of C
- e → concentration of E,
that they could simulate/match with the decomposition of the main components:
- hemicelluloses
- cellulose
- lignin.
Reference
Detailed information about this study can be found in the article: T. Asimakidou, K. Chrissafis, Journal of Thermal Analysis and Calorimetry (2022) 147:9045–9054 https://doi.org/10.1007/s10973-021-11163-w
[1] M. Elbir, A. Moubarik, E.M. Rakib, N. Grimi, A. Amhoud, G. Miguel, H. Hanine, J. Artaud, P. Vanloot, M. Mbarki, Valorization of moroccan olive stones by using it in particleboard panels, Maderas Cienc. y Tecnol. 14 (2012) 361–371. https://doi.org/10.4067/S0718-221X2012005000008.
[2] K. Chrissafis, Kinetics of thermal degradation of polymers : Complementary use of isoconversional and model-fitting methods, J. Therm. Anal. Calorim. 95 (2009) 273–283. https://doi.org/10.1007/s10973-008-9041-z.
[3] E. Moukhina, Determination of kinetic mechanisms for reactions measured with thermoanalytical instruments, J. Therm. Anal. Calorim. 109 (2012) 1203–1214. https://doi.org/10.1007/s10973-012-2406-3.
[4] S. Sobek, S. Werle, Kinetic modelling of waste wood devolatilization during pyrolysis based on thermogravimetric data and solar pyrolysis reactor performance, Fuel. 261 (2020). https://doi.org/10.1016/j.fuel.2019.116459.
[5] A.F. Koutsomitopoulou, J.C. Bénézet, A. Bergeret, G.C. Papanicolaou, Preparation and characterization of olive pit powder as a filler to PLA-matrix bio-composites, Powder Technol. 255 (2014) 10–16. https://doi.org/10.1016/j.powtec.2013.10.047.