How To: Prepare Data for Analysis of Curing with Diffusion Control
Curing of Epoxy Resin with Partial Diffusion Control
Part 1. How To: Prepare DSC Data for Analysis of Curing (DSC Curing with Diffusion Control)
Introduction
If the glass-transition appears during the cross-linkage of a thermoset, then the reaction is separated into two domains that are dominated by different mechanisms: The part taking place far above glass-transition depends on the chemical reaction and can be described by the Arrhenius relation. In the part below glass-transition diffusion controlled mechanisms dominate the reaction behavior. Therefore, the reaction rate around the glass-transition is influenced by both processes.
That's why the kinetic model has to be expanded by the special diffusion control algorithms in order to take into account the change of the material behavior.
In this "How To:" The data for DSC curing with partial diffusion control will be created. These data contains of two parts:
- DSC measurements of the curing process with different heating rates,
- Dependence of glass transition temperature on degree of conversion.
We will start by loading a experimental data included in Kinetics Neo, will then create a experimental dependence for glass transition temperature vs conversion, and then create the theoretical fit for this last dependence.
Sample data:
- Data Type: DSC Curing (Differential Scanning Calorimetry with Diffusion Control)
- Project Data: in directory DSC_Diff_Control_Epoxy
How Many Measurements Are Necessary For The Analysis
For reaction with diffusion control the curing mechanism depends on the glass transition temperature. For analysis of these reaction we need at least two measurements with higher heating rates, where no glass transition happens. Additionally we need at least three measurement with low and very low heating rates, where sample temperature is about glass transition during the measurement, and the slowing of reaction because of diffusion control is clearly seen.
So we need at least 5 measurements with different heating rates in order to analyze the data with diffusion control.
Additionally the dependence Tg vs alpha should be known. If it is not known, then it should be measured. We need Tg for uncured state, for totally cured state and the couple of points for partially cured states. Thus, these are additional 4 measurements for 4 points for the dependence Tg vs alpha.
Create Project and Load Data
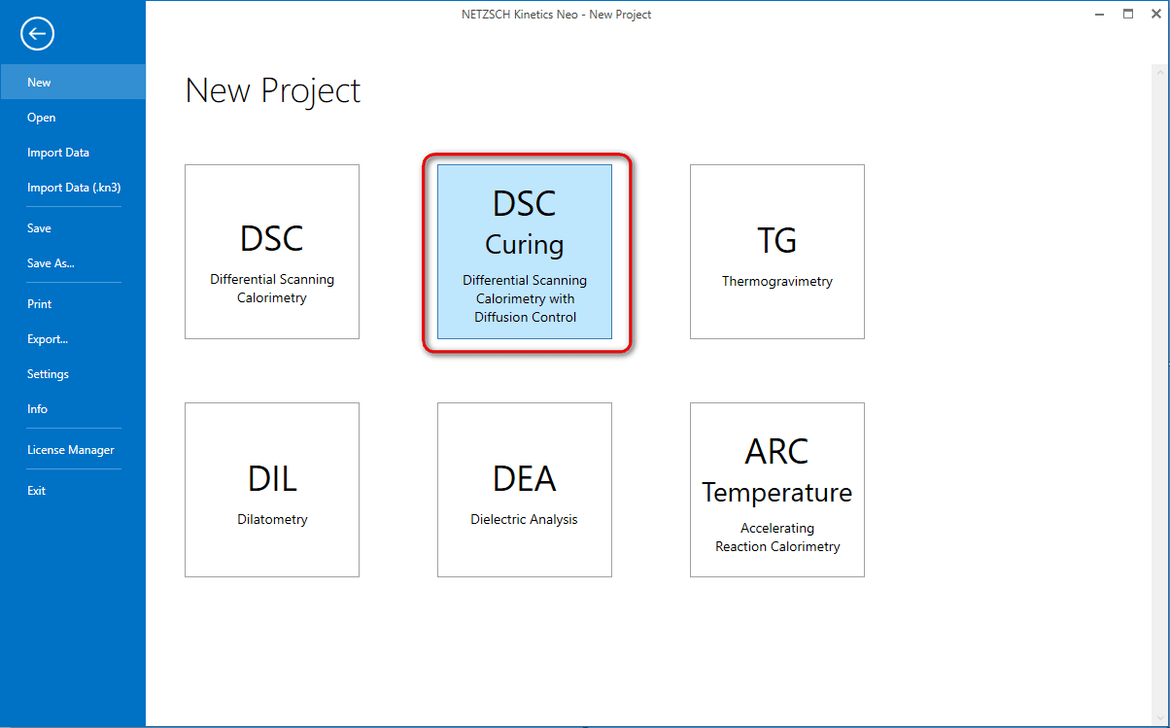
1. Start the Kinetics Neo software. Click on the blue "File" tab to open the application menu.
2. Select New Project of type DSC Curing.
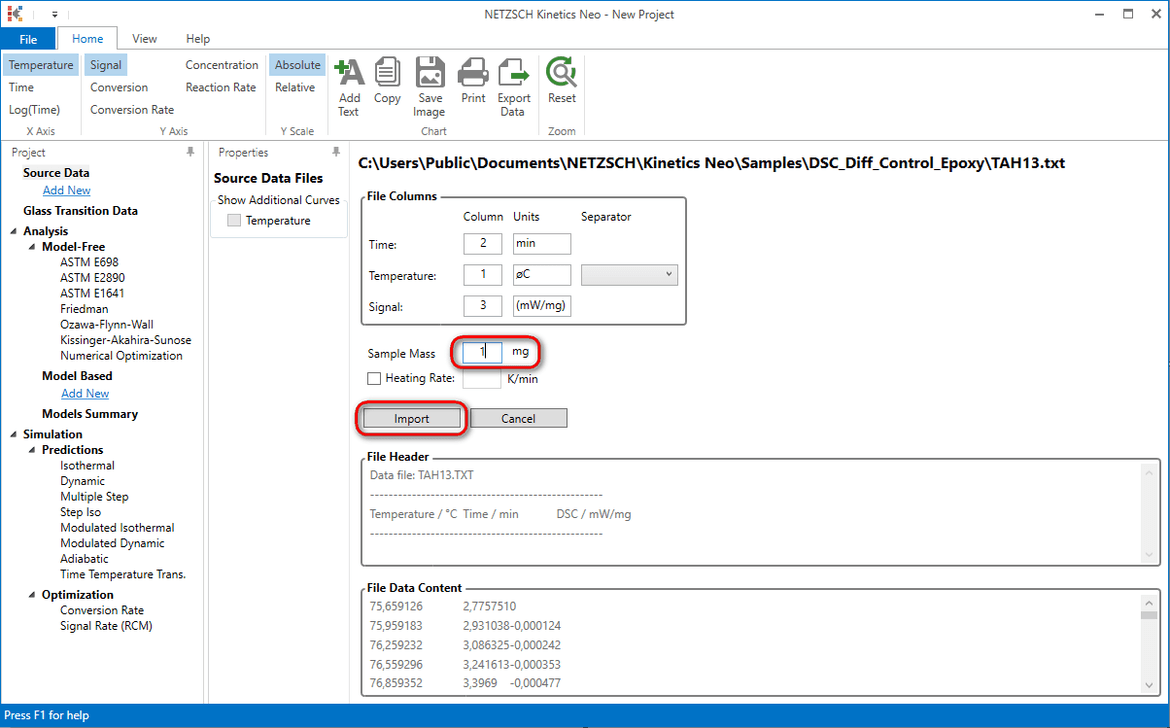
3. Select Import Data-Samples and select directory DSC_Diff_Control_Epoxy
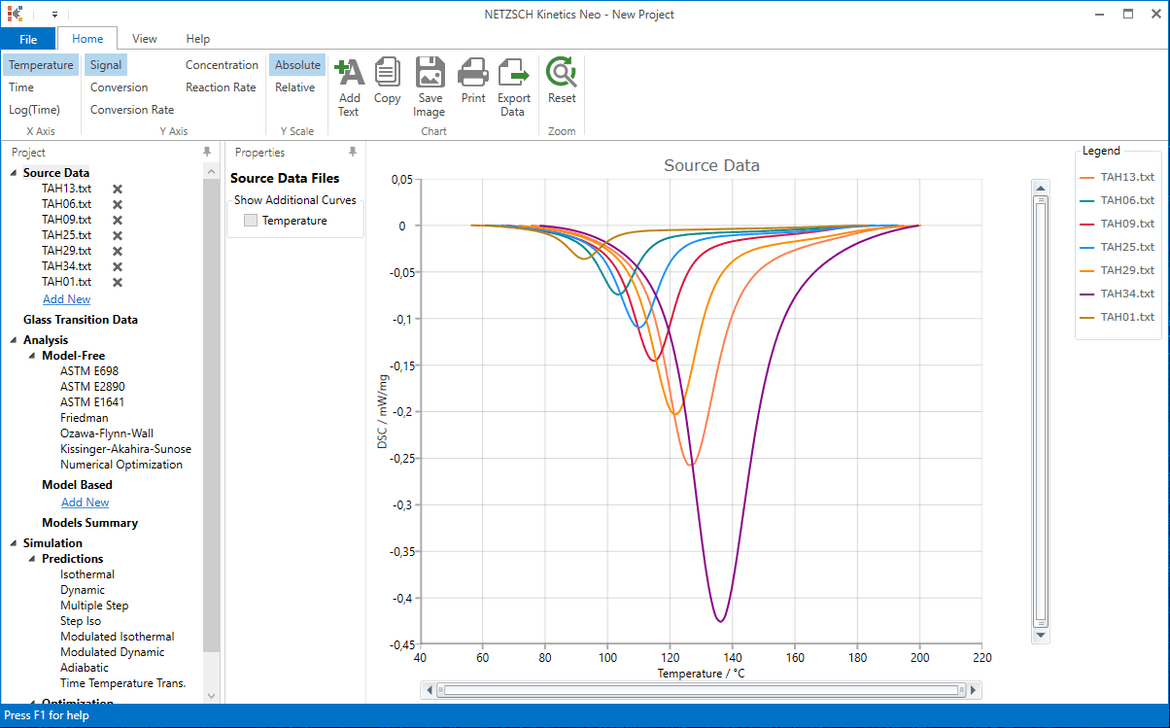
4. Select data file TAH13.txt, set 1 mg for obligatory sample Mass to and then select Import. Here data are already in relative units in mW/mg and therefore sample mass is not important.
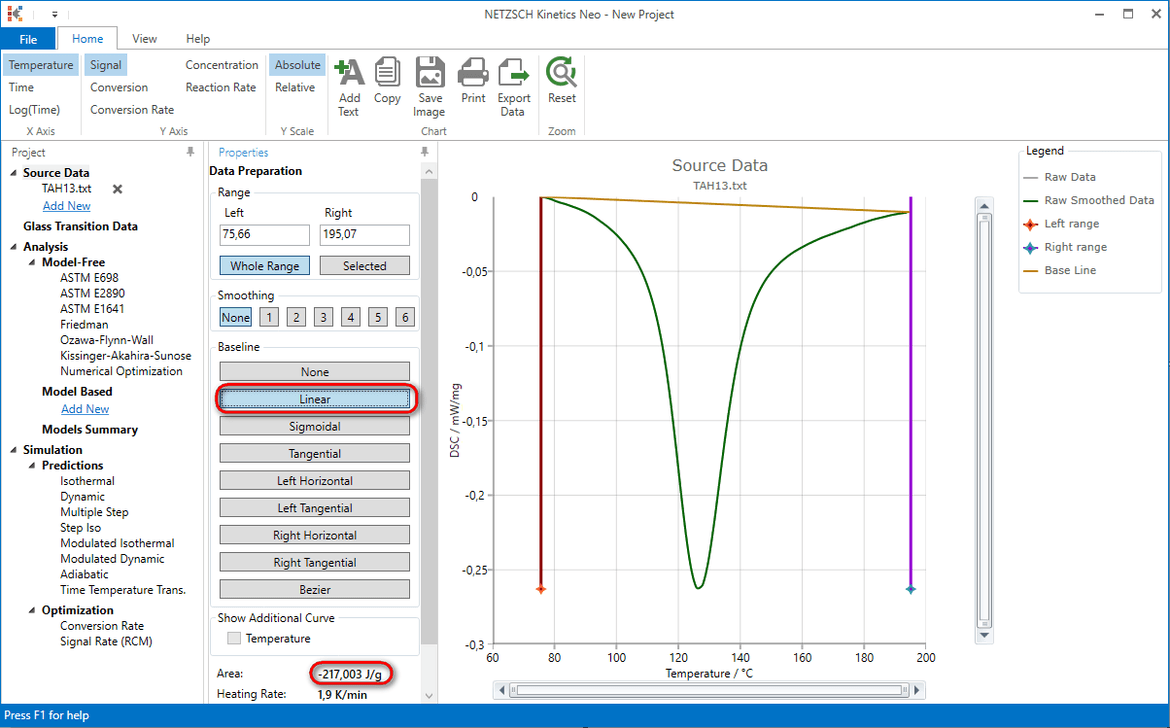
5. Select linear baseline, read area value (here is 217J/g) and click on OK
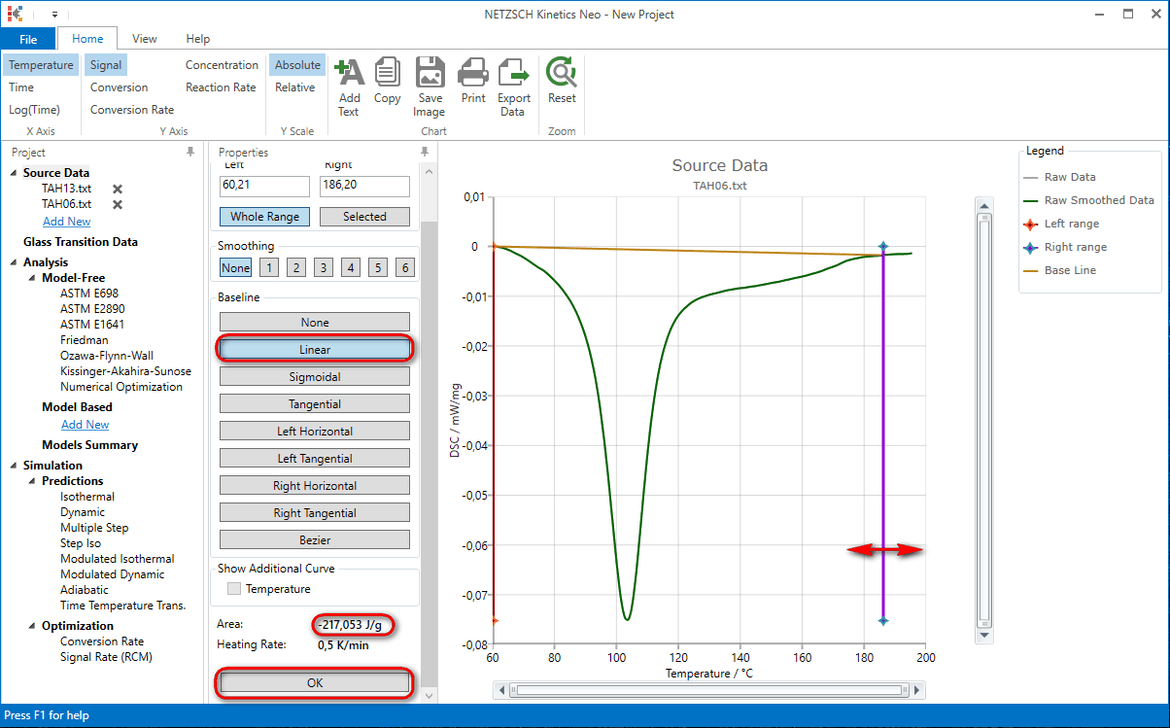
6. In the tree panel select Source Data -> Add new and repeat data import (step 4) for the file TAH06.txt.
7. For the file TAH06.txt select again linear baseline and move right vertical line in order to get the same area of 217J/g. Click OK
8. In the tree panel select Source Data -> Add new and repeat steps 6-7 for the files TAH09.txt, TAH25.txt, TAH29.txt, TAH34.txt, TAH01.txt.
Create Table with Glass Transition Temperature
If the part of reaction takes place below glass transition temperature, and another part of reaction is above it then the reaction mechanism is changed. This change occurs when the sample temperature crosses the glass transition temperature. That’s why it is very important to know the value of glass transition temperature during reaction. Glass transition temperature as the function of the conversion must be entered.
In order to get one experimental point, it is necessary to perform one experimental measurement containing three segments:
- Heating until the time point, where the curing reaction is already started, but still not finished.
- Cooling until the temperature much below glass transition temperature of uncured material.
- Heating to the completely cured state.
The area of the rest reaction in the third segment allows to find the rest conversion of partially cured material. Additionally, the evaluation of the glass transition in the third segment gives the glass transition for the partially cured material.
The values of:
- the conversion for partially cured material and
- the corresponding glass transition temperature
make one experimental point in the table Glass Transition Data. It is recommended to use at least 6 such points. More points increase the precision of the kinetics model.
9. In the tree panel select Glass transition Data and add point to the data table.
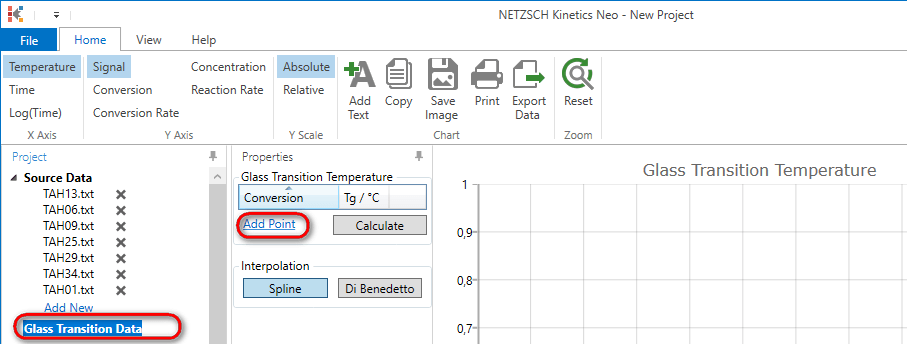
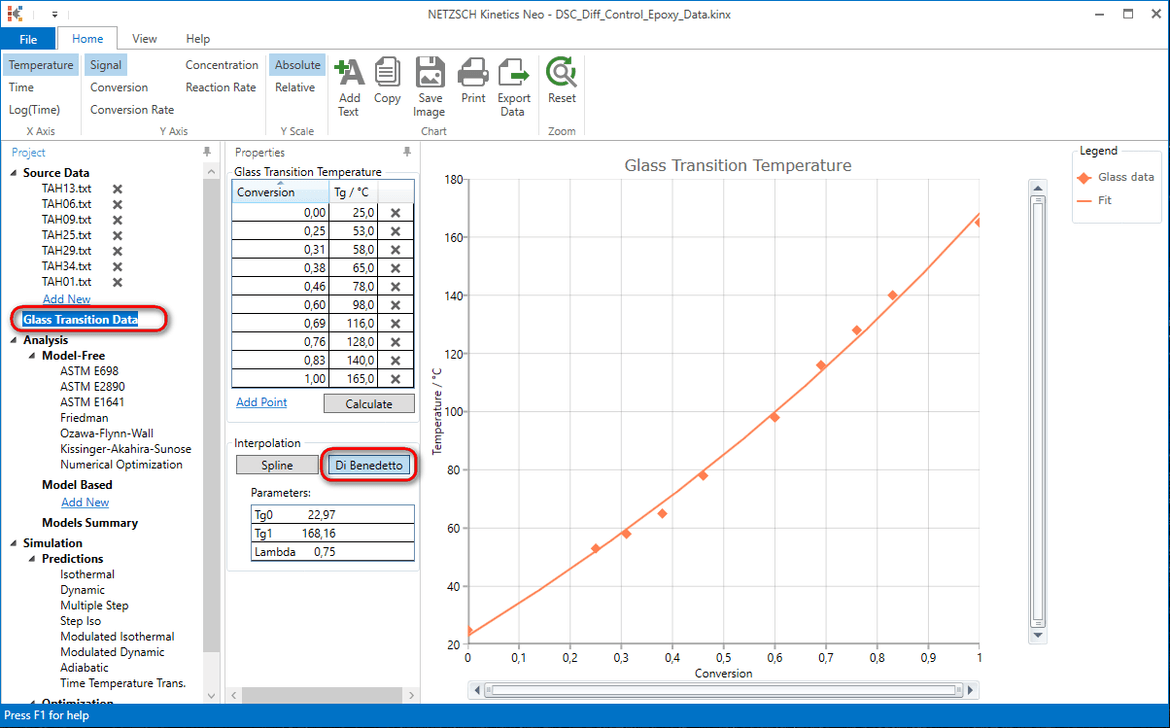
10. Add the following points to the data table.
| Conversion | Tg /°C |
|---|---|
| 0.000 | 25.0 |
| 0.250 | 53.0 |
| 0.310 | 58.0 |
| 0.380 | 65.0 |
| 0.460 | 78.0 |
| 0.600 | 98.0 |
| 0.690 | 116.0 |
| 0.760 | 128.0 |
| 0.830 | 140.0 |
| 1.000 | 165.0 |
Create Fit for Glass Transition vs Conversion
There are two possibility to create the fit for Glass Transition temperature:
- Classical theoretical diBenedetto model.
- Spline function through the experimental points. It is used for the complex systems containing complicated dependence of glass transition temperature vs degree of conversion.
11. Select DiBenedetto fit for the current experimental data set.
Conclusion
The data for kinetic analysis contain several DSC measurements and additionally dependence of Glass transition on degree of conversion. These data can be used for the kinetic modelling and then for the prediction and process optimization.