How To: Create TTT Diagram
Time-Temperature-Transition (Time-Temperature-Transformation) Diagram for Polymers Time-temperature-transition (time-temperature-transformation) or TTT diagram shows time dependence of material transformation at given temperature.Time-Temperature-Transition Diagram for Epoxy Curing Reaction with Diffusion Control
Part 1. How To: Prepare DSC Data for Analysis of Curing (DSC Curing with Diffusion Control)
Part 3. How To: Create TTT diagram for DSC Curing Data (Epoxy Curing Reaction with Diffusion Control)
Introduction
In this "How To:" the Time-Temperature-Transition diagram will be created.
A Time-Temperature-Transition (TTT) diagram offers the opportunity to simulate the cure behavior as well as the glass-transition evolution in isothermal temperature conditions.
We will start with the existing Sample Project for the curing reaction with diffusion control, will then create Time-Temperature-Transition diagram and see, what kind of data it presents.
Sample data:
- Data Type: DSC Curing (Differential Scanning Calorimetry with Diffusion Control)
- Project File: DSC_Diff_Control_Epoxy_Analysis.kinx
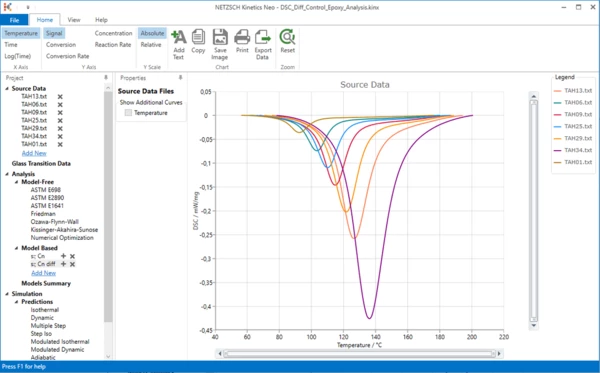
Load the Sample Data Project
1. Start the Kinetics Neo software. Click on the blue "File" tab to open the application menu.
2. Click on "Open" in the menu on the left side, then select "Samples".
The Kinetics Neo samples directory will be opened in Windows Explorer.
Select directory DSC_Diff_Control_Epoxy.
3. Open the Kinetics Neo project file "DSC_Diff_Control_Epoxy_Analysis.kinx" .
Iso-conversion curves
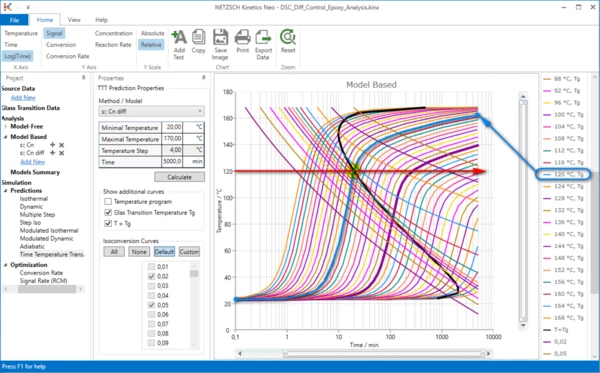
4. Switch X-Axis to Log(time) in the left side of main ribbon toolbar and then in the left tree panel select Simulation -> Predictions -> Time-Temperature-Transition.
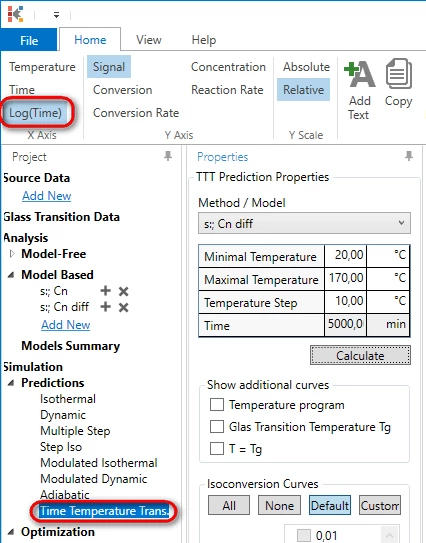
5. In the Method/Model list select Model Cn, diff. Set Parameters:
- Minimal Temperature 20°C,
- Maximal Temperature 170°C,
- Temperature Step 10°C,
- time 5000min.
Press Calculate.
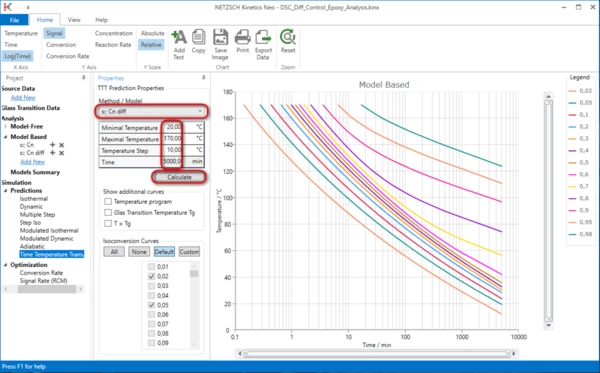
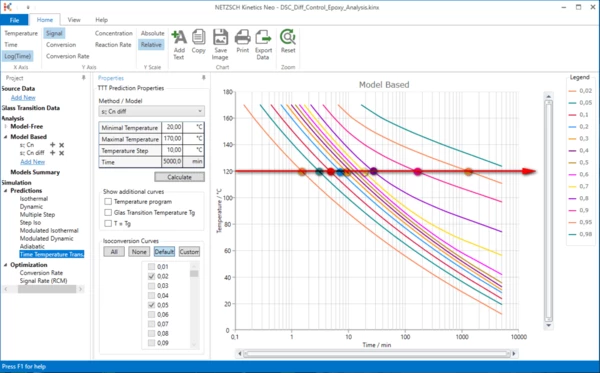
6. How to interpret the predictions for iso-conversion curves?
Iso-conversion curves are the curves with the same degree of conversion.
- Select a temperature you are interesting in on Y axis (for example, 120 °C).
- Create imaginary horizontal line from this temperature to the right.
- Check where this imaginary line crosses the iso-conversion curves.
For isothermal prediction of 120°C the process has:
- 2% of conversion at 1.5min,
- 5% at 3min,
- 10% at 4.7min,
- …
- 70% at almost 20min,
- 90% at ca. 150 min.
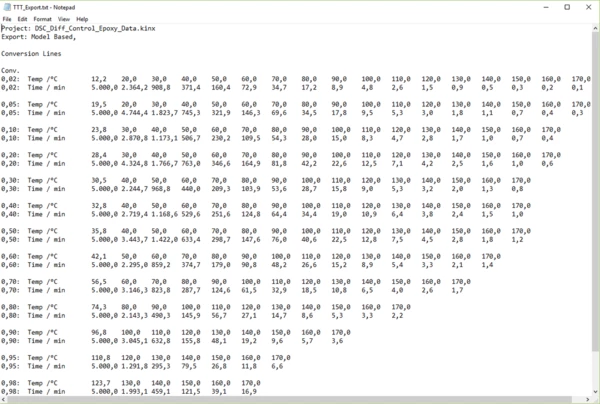
7. Select Export Data on the main ribbon toolbar and save the values of iso-conversion curves in the text file.
In the exported file for each defined conversion value two lines are present:
- the first line presents the temperature,
- the second line presents the time, which is necessary to achieve the defined conversion at the isothermal condition with given temperature.
Prediction of Glass transition Temperature for isothermal conditions
8. Turn On the Glass transition Temperature.
In the TTT Prediction Properties pane turn on the option Glass Transition Temperature Tg.
For better presentation, show data beginning from 0.1 by moving the left edge of horizontal toolbar.
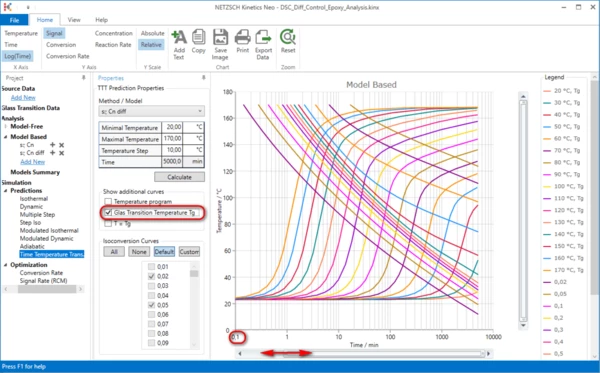
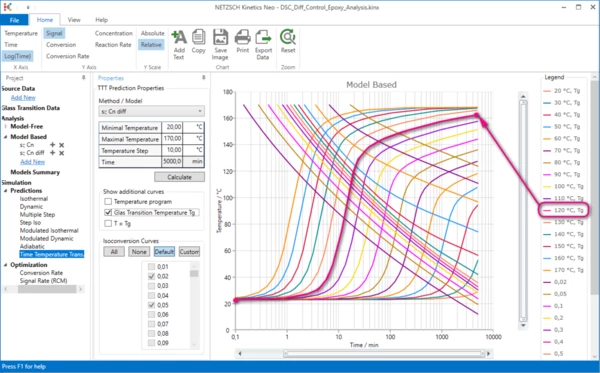
9. How to interpret the predictions for Glass transition temperature.
The curve marked as 120°C shows the changing of glass transition temperature during the isothemal curing at 120°C. This glass transition temperature changes during this isothermal reaction from 25°C (uncured state) to 163°C (almost full cured state).
Vitrification Curve
10. Write 4°C for temperature step and turn On the visibility of curve T=Tg. Press Calculate.
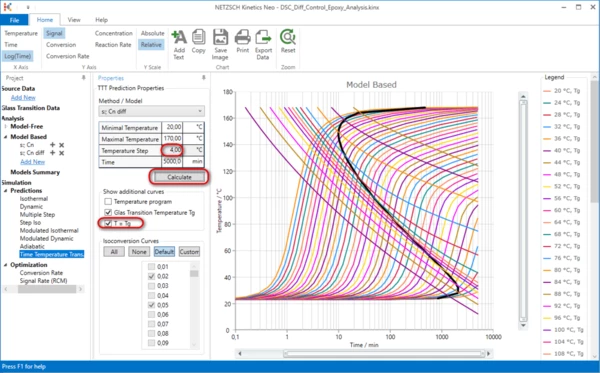
11. How to interpret the vitrification curve T=Tg (black curve)?
During the isothermal curing, e.g. at 120°C (red horizontal line), the glass transition temperature (light blue curve) changes from its minimal temperature (here 25°C) to fast its maximal temperature (here 165°C). These two temperatures are crossing at 20 min and show the point where sample temperature is equal to the glass transition temperature.
Vitrification curve (black) presents such points with T=Tg at the different isothermal curing conditions.
Vitrification curve divides the diagram area into two parts:
- Left part is elastic rubbery state;
- Right part is glassy state.
Gelation Curve
12. If the conversion for gelation point is known then gelation curve can be shown. Let us show gelation curve for known conversion value 52%.
Write 1°C for temperature step and turn Off Glass transition Temperature Tg.
Press Calculate.
For Isoconversion Lines click None, then Custom and select one value 0.52.
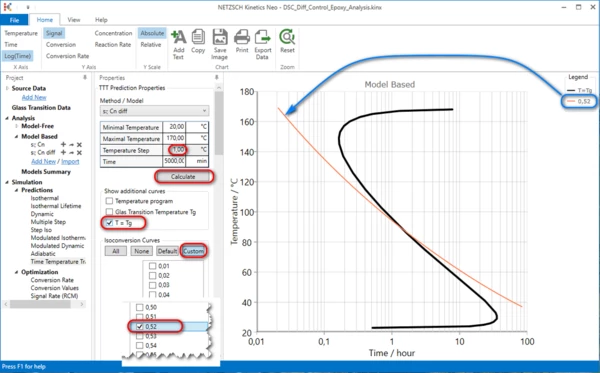
Conclusion
Time-Temperature-Transition Diagram present the degree of curing of the chemical system at the isothermal conditions, as well as changing of glass transition temperature. It shows vitrification curve separating the glassy state and rubbery state.